How to add image watermark in presentation slides
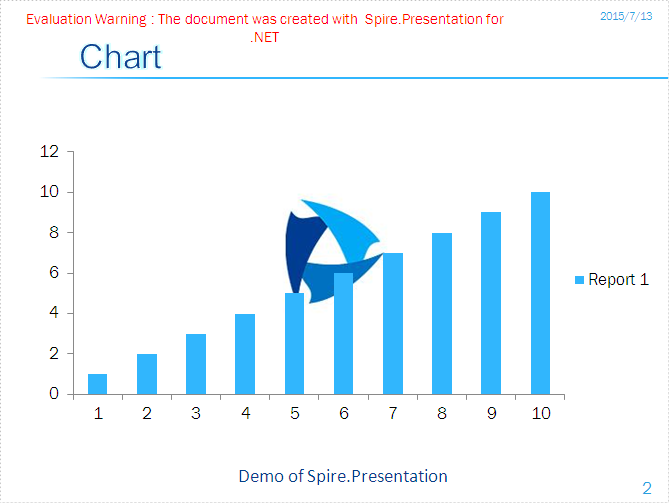
There are two kinds of watermarks in PowerPoint documents we usually used in presentation slides: text watermark and image watermark. Text watermark and image watermark are used to make the presentation slides more attractive and shows the copyright information of the presentation slides. We have already shown you how to add text watermark to presentation slides, this section will show you how to add image watermark in PowerPoint document in C#.
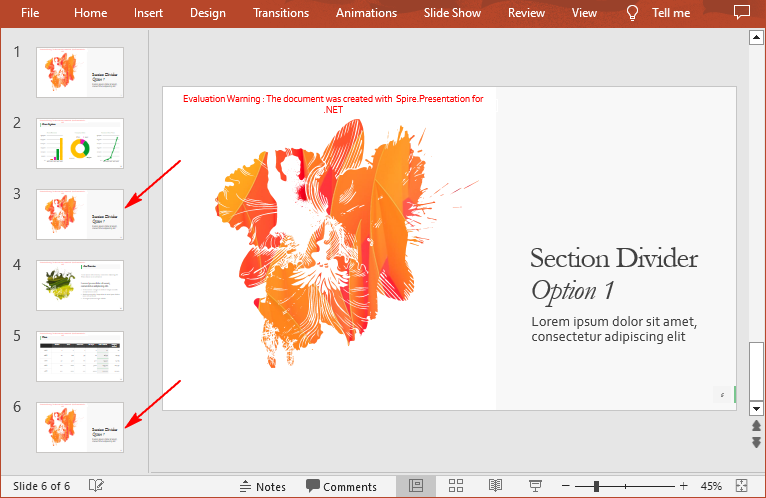
Firstly, please check the effective screenshot of the image watermark in PowerPoint file added by Spire.Presentation.
Here comes to the steps of how to add text watermark in C#:
Step 1: Create a presentation document and load the document from the file
Presentation ppt = new Presentation();
ppt.LoadFromFile("sample.pptx");
Step 2: Set the image background type and style for the second slide in the presentation.
ppt.Slides[1].SlideBackground.Type = Spire.Presentation.Drawing.BackgroundType.Custom;
ppt.Slides[1].SlideBackground.Fill.FillType = FillFormatType.Picture;
ppt.Slides[1].SlideBackground.Fill.PictureFill.FillType = PictureFillType.Stretch;
Step 3: Insert the image as the image watermark.
Image img= Image.FromFile ("logo.png");
IImageData image = ppt.Images.Append(img);
ppt.Slides[1].SlideBackground.Fill.PictureFill.Picture.EmbedImage = image;
Step 4: Save the document.
ppt.SaveToFile("result.pptx", Spire.Presentation.FileFormat.Pptx2007);
Full codes:
using Spire.Presentation;
using Spire.Presentation.Drawing;
using System.Drawing;
namespace AddimageWatermark
{

    class Program
    {

        static void Main(string[] args)
        {
            Presentation ppt = new Presentation();
            ppt.LoadFromFile("sample.pptx");

            ppt.Slides[1].SlideBackground.Type = Spire.Presentation.Drawing.BackgroundType.Custom;
            ppt.Slides[1].SlideBackground.Fill.FillType = FillFormatType.Picture;
            ppt.Slides[1].SlideBackground.Fill.PictureFill.FillType = PictureFillType.Stretch;

            Image img = Image.FromFile("logo.png");
            IImageData image = ppt.Images.Append(img);
            ppt.Slides[1].SlideBackground.Fill.PictureFill.Picture.EmbedImage = image;
            ppt.SaveToFile("result.pptx", Spire.Presentation.FileFormat.Pptx2007);
        }
    }
}
How to set margins for text inside shapes in C#
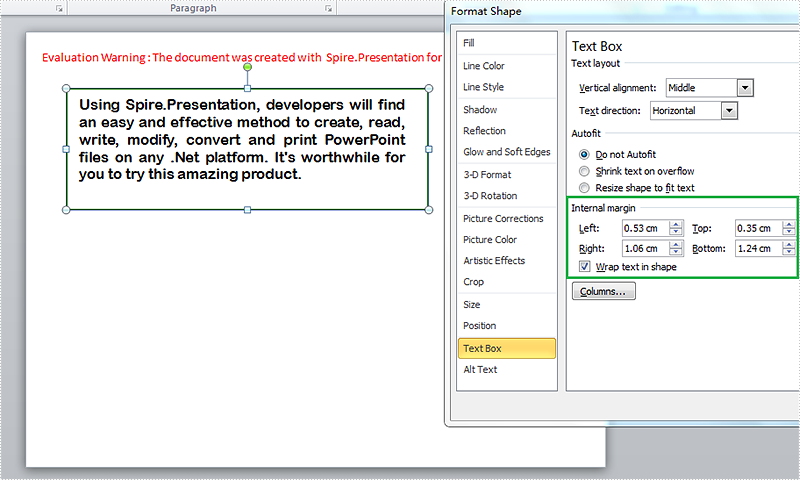
Margin is the space between the text and the edge of paper or shape. MS office sets default margins for users but usually we need to reset the margins to best fit our formatting needs. In Presentation, text is often inside a shape or textbox, and there is an option to set the margins for text inside shapes. It’s worthy of mentioning that Spire.Presentation provides the APIs to help users set margins for text inside shapes. This article is going to introduce the method to set the internal margins of shapes in C# using Spire.Presentation.
Note: before start, please download the latest version of Spire.Presentation and use the .dll in the bin folder as the reference of Visual Studio.
Step 1: Initial a new Presentation and insert a sample shape.
Presentation presentation = new Presentation();
IAutoShape shape = presentation.Slides[0].Shapes.AppendShape(ShapeType.Rectangle, new RectangleF(50, 70, 450, 150));
Step 2: Add sample text into the shape and format the text.
            shape.Fill.FillType = FillFormatType.None;
            shape.ShapeStyle.LineColor.Color = Color.DarkGreen;
            shape.TextFrame.Paragraphs[0].Alignment = TextAlignmentType.Justify;
            shape.TextFrame.Text = "Using Spire.Presentation, developers will find an easy and effective method to create, read, write, modify, convert and print PowerPoint files on any .Net platform. It's worthwhile for you to try this amazing product.";
            shape.TextFrame.Paragraphs[0].TextRanges[0].LatinFont = new TextFont("Arial Rounded MT Bold");
            shape.TextFrame.Paragraphs[0].TextRanges[0].Fill.FillType = FillFormatType.Solid;
            shape.TextFrame.Paragraphs[0].TextRanges[0].Fill.SolidColor.Color = Color.Black;
Step 3: Set the margins for the text frame.
            shape.TextFrame.MarginTop = 10;
            shape.TextFrame.MarginBottom = 35;
            shape.TextFrame.MarginLeft = 15;
            shape.TextFrame.MarginRight = 30;
Step 4: Save the document and launch to see effects.
            presentation.SaveToFile("result.pptx", FileFormat.Pptx2010);
            System.Diagnostics.Process.Start("result.pptx");
Effects:
Full Codes:
using System;
using System.Collections.Generic;
using System.Linq;
using System.Text;
using Spire.Presentation;
using Spire.Presentation.Drawing;
using System.Drawing;

namespace test
{
    class Program
    {
        static void Main(string[] args)
        {
            Presentation presentation = new Presentation();
            IAutoShape shape = presentation.Slides[0].Shapes.AppendShape(ShapeType.Rectangle, new RectangleF(50, 70, 450, 150));

            shape.Fill.FillType = FillFormatType.None;
            shape.ShapeStyle.LineColor.Color = Color.DarkGreen;
            shape.TextFrame.Paragraphs[0].Alignment = TextAlignmentType.Justify;
            shape.TextFrame.Text = "Using Spire.Presentation, developers will find an easy and effective method to create, read, write, modify, convert and print PowerPoint files on any .Net platform. It's worthwhile for you to try this amazing product.";
            shape.TextFrame.Paragraphs[0].TextRanges[0].LatinFont = new TextFont("Arial Rounded MT Bold");
            shape.TextFrame.Paragraphs[0].TextRanges[0].Fill.FillType = FillFormatType.Solid;
            shape.TextFrame.Paragraphs[0].TextRanges[0].Fill.SolidColor.Color = Color.Black;

            shape.TextFrame.MarginTop = 10;
            shape.TextFrame.MarginBottom = 35;
            shape.TextFrame.MarginLeft = 15;
            shape.TextFrame.MarginRight = 30;

            presentation.SaveToFile("result.pptx", FileFormat.Pptx2010);
            System.Diagnostics.Process.Start("result.pptx");

        }
    }
}
Show formula and its result separately when converting excel to datatable in C#
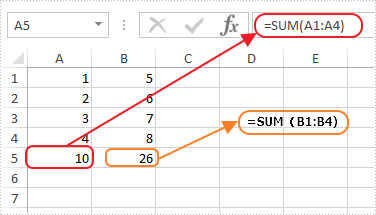
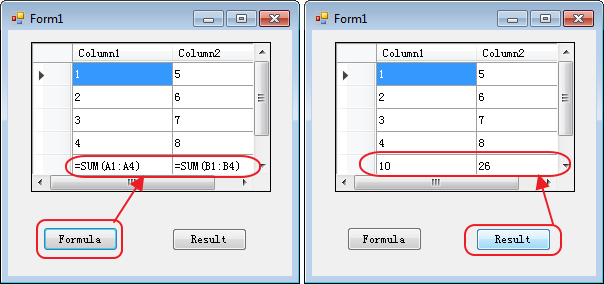
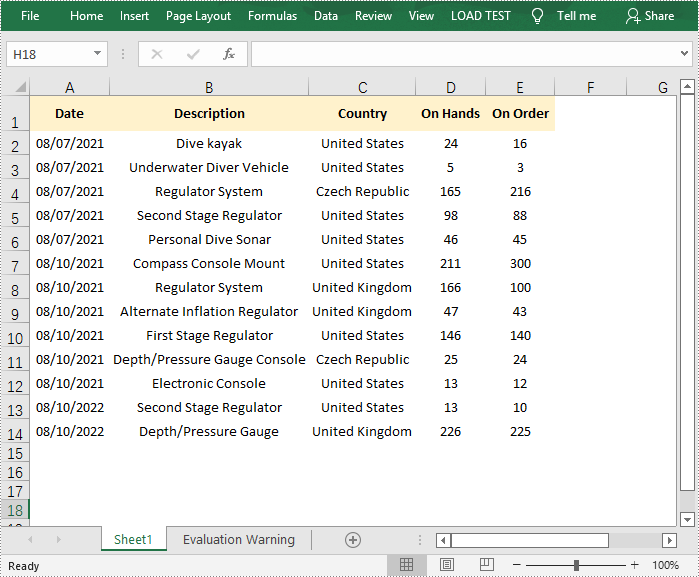
This article shows how to display formula and its result separately when converting excel to database via Spire.XLS. This demo uses an Excel file with formula in it and show the conversion result in a Windows Forms Application project.
Screenshot of the test excel file:
Here are the detailed steps:
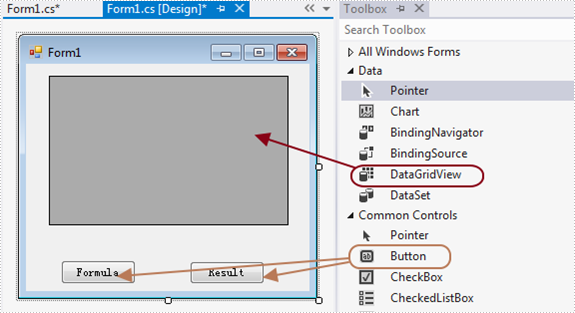
Steps 1: Create a Windows Forms Application in Visual Studio.
Steps 2: Drag a DataGridView and two Buttons from Toolbox to the Form and change names of the buttons as Formula and Result to distinguish.
Steps 3: Double click Button formula and add the following code.
3.1 Load test file and get the first sheet.
Workbook workbook = new Workbook();
workbook.LoadFromFile(@"1.xlsx");
Worksheet sheet = workbook.Worksheets[0];
3.2 Invoke method ExportDataTable of the sheet and output data range. Parameters of ExportDataTable are range to export, indicates if export column name and indicates whether compute formula value, then it will return exported datatable.
Description of ExportDataTable:
public DataTable ExportDataTable(CellRange range, bool exportColumnNames, bool computedFormulaValue);
Code:
DataTable dt = sheet.ExportDataTable(sheet.AllocatedRange, false, false);
3.3 Show in DataGridView
this.dataGridView1.DataSource = dt;
Steps 4: Do ditto to Button Result. Only alter parameter computedFormulaValue as true.
Workbook workbook = new Workbook();
workbook.LoadFromFile(@"1.xlsx");
Worksheet sheet = workbook.Worksheets[0];
DataTable dt = sheet.ExportDataTable(sheet.AllocatedRange, false, true);
this.dataGridView1.DataSource = dt;
Steps 5: Start the project and check the result.
Button code here:
//Formula
private void button1_Click(object sender, EventArgs e)
{
Workbook workbook = new Workbook();
workbook.LoadFromFile(@"1.xlsx");
Worksheet sheet = workbook.Worksheets[0];
DataTable dt = sheet.ExportDataTable(sheet.AllocatedRange, false, false);
this.dataGridView1.DataSource = dt;

}
//Result
private void button2_Click(object sender, EventArgs e)
{
Workbook workbook = new Workbook();
workbook.LoadFromFile(@"1.xlsx");
Worksheet sheet = workbook.Worksheets[0];
DataTable dt = sheet.ExportDataTable(sheet.AllocatedRange, false, true);
this.dataGridView1.DataSource = dt;
}
C#/VB.NET: Hide or Show Gridlines in Excel
Gridlines are the faint lines used to distinguish cells in an Excel worksheet. With gridlines, users can easily distinguish the boundaries of each cell and read data in an organized manner. But in certain cases, those gridlines can be quite distracting. In this article, you will learn how to programmatically show or hide/remove gridlines in an Excel worksheet using Spire.XLS for .NET.
Install Spire.XLS for .NET
To begin with, you need to add the DLL files included in the Spire.XLS for .NET package as references in your .NET project. The DLL files can be either downloaded from this link or installed via NuGet.
PM> Install-Package Spire.XLS
Hide or Show Gridlines in Excel
The detailed steps are as follows.
- Create a Workbook object.
- Load a sample Excel document using Workbook.LoadFromFile() method.
- Get a specified worksheet using Workbook.Worksheets[] property.
- Hide or show gridlines in the specified worksheet using Worksheet.GridLinesVisible property.
- Save the result file using Workbook.SaveToFile() method.
- C#
- VB.NET
using Spire.Xls;

namespace RemoveGridlines
{
    class Program
    {

        static void Main(string[] args)
        {
            //Create a Workbook object
            Workbook workbook = new Workbook();

            //Load a sample Excel document
            workbook.LoadFromFile(@"E:\Files\Test.xlsx");

            //Get the first worksheet
            Worksheet worksheet = workbook.Worksheets[0];

            //Hide gridlines in the specified worksheet
            worksheet.GridLinesVisible = false;

            //Show gridlines in the specified worksheet
            //worksheet.GridLinesVisible = true;

            //Save the document
            workbook.SaveToFile("Gridlines.xlsx", ExcelVersion.Version2010);
        }
    }
}
Apply for a Temporary License
If you'd like to remove the evaluation message from the generated documents, or to get rid of the function limitations, please request a 30-day trial license for yourself.
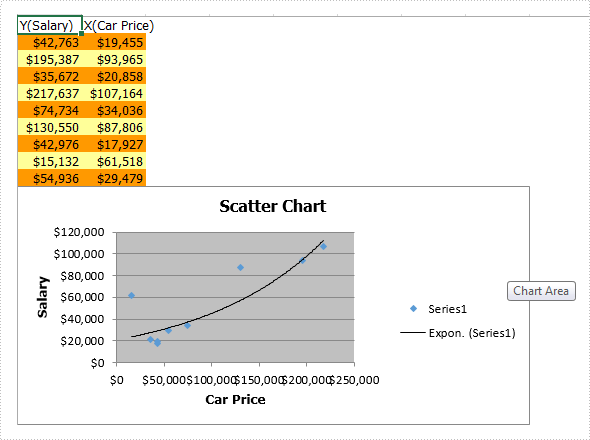
Create Excel Scatter Chart in C#
Charts are used to display series of numeric data in a graphical format to make it easier to understand large quantities of data and the relationship between different series of data. This article talks about how to create scatter chart via Spire.XLS.
To create a Scatter Chart, execute the following steps.
Step 1: Create a new Excel document and get the first sheet.
Workbook workbook = new Workbook();
workbook.CreateEmptySheets(1);
Worksheet sheet = workbook.Worksheets[0];
Step 2: Rename the first sheet and set the grid lines invisible.
sheet.Name = "Scatter Chart";
sheet.GridLinesVisible = false;
Step 3: Create a scatter chart and set data region for it.
Chart chart = sheet.Charts.Add(ExcelChartType.ScatterMarkers);
chart.DataRange = sheet.Range["B2:B10"];
chart.SeriesDataFromRange = false;
Step 4: Set position and title for the chart.
chart.LeftColumn = 1;
chart.TopRow = 6;
chart.RightColumn = 9;
chart.BottomRow = 25;

chart.ChartTitle = "Scatter Chart";
chart.ChartTitleArea.IsBold = true;
chart.ChartTitleArea.Size = 12;
Step 5: Add data to the excel range.
sheet.Range["A1"].Value = "Y(Salary)";
sheet.Range["A2"].Value = "42763";
sheet.Range["A3"].Value = "195387";
sheet.Range["A4"].Value = "35672";
sheet.Range["A5"].Value = "217637";
sheet.Range["A6"].Value = "74734";
sheet.Range["A7"].Value = "130550";
sheet.Range["A8"].Value = "42976";
sheet.Range["A9"].Value = "15132";
sheet.Range["A10"].Value = "54936";

sheet.Range["B1"].Value = "X(Car Price)";
sheet.Range["B2"].Value = "19455";
sheet.Range["B3"].Value = "93965";
sheet.Range["B4"].Value = "20858";
sheet.Range["B5"].Value = "107164";
sheet.Range["B6"].Value = "34036";
sheet.Range["B7"].Value = "87806";
sheet.Range["B8"].Value = "17927";
sheet.Range["B9"].Value = "61518";
sheet.Range["B10"].Value = "29479";
Step 6: Set style color for the range.
sheet.Range["A2:B2"].Style.KnownColor = ExcelColors.LightOrange;
sheet.Range["A3:B3"].Style.KnownColor = ExcelColors.LightYellow;
sheet.Range["A4:B4"].Style.KnownColor = ExcelColors.LightOrange;
sheet.Range["A5:B5"].Style.KnownColor = ExcelColors.LightYellow;
sheet.Range["A6:B6"].Style.KnownColor = ExcelColors.LightOrange;
sheet.Range["A7:B7"].Style.KnownColor = ExcelColors.LightYellow;
sheet.Range["A8:B8"].Style.KnownColor = ExcelColors.LightOrange;
sheet.Range["A9:B9"].Style.KnownColor = ExcelColors.LightYellow;
sheet.Range["A10:B10"].Style.KnownColor = ExcelColors.LightOrange;
Step 7: Set number format for cell ranges.
sheet.Range["A2:B10"].Style.NumberFormat = "\"$\"#,##0";
Step 8: Set data for axis x y.
chart.Series[0].CategoryLabels = sheet.Range["A2:A10"];
chart.Series[0].Values = sheet.Range["B2:B10"];
Step 9: Add a trend line.
chart.Series[0].TrendLines.Add(TrendLineType.Exponential);
Step 10: Add axis title.
chart.PrimaryValueAxis.Title = "Salary";
chart.PrimaryCategoryAxis.Title = "Car Price";
Step 11: Save and review.
workbook.SaveToFile("XYChart.xlsx", FileFormat.Version2013);
System.Diagnostics.Process.Start("XYChart.xlsx");
Screenshot:
Full code:
using Spire.Xls;
namespace CreateExcelScatterChart
{
    class Program
    {

        static void Main(string[] args)
        {
            Workbook workbook = new Workbook();
            workbook.CreateEmptySheets(1);
            Worksheet sheet = workbook.Worksheets[0];

            sheet.Name = "Scatter Chart";
            sheet.GridLinesVisible = false;

            Chart chart = sheet.Charts.Add(ExcelChartType.ScatterMarkers);
            chart.DataRange = sheet.Range["B2:B10"];
            chart.SeriesDataFromRange = false;

            chart.LeftColumn = 1;
            chart.TopRow = 6;
            chart.RightColumn = 9;
            chart.BottomRow = 25;

            chart.ChartTitle = "Scatter Chart";
            chart.ChartTitleArea.IsBold = true;
            chart.ChartTitleArea.Size = 12;

            sheet.Range["A1"].Value = "Y(Salary)";
            sheet.Range["A2"].Value = "42763";
            sheet.Range["A3"].Value = "195387";
            sheet.Range["A4"].Value = "35672";
            sheet.Range["A5"].Value = "217637";
            sheet.Range["A6"].Value = "74734";
            sheet.Range["A7"].Value = "130550";
            sheet.Range["A8"].Value = "42976";
            sheet.Range["A9"].Value = "15132";
            sheet.Range["A10"].Value = "54936";

            sheet.Range["B1"].Value = "X(Car Price)";
            sheet.Range["B2"].Value = "19455";
            sheet.Range["B3"].Value = "93965";
            sheet.Range["B4"].Value = "20858";
            sheet.Range["B5"].Value = "107164";
            sheet.Range["B6"].Value = "34036";
            sheet.Range["B7"].Value = "87806";
            sheet.Range["B8"].Value = "17927";
            sheet.Range["B9"].Value = "61518";
            sheet.Range["B10"].Value = "29479";

            sheet.Range["A2:B2"].Style.KnownColor = ExcelColors.LightOrange;
            sheet.Range["A3:B3"].Style.KnownColor = ExcelColors.LightYellow;
            sheet.Range["A4:B4"].Style.KnownColor = ExcelColors.LightOrange;
            sheet.Range["A5:B5"].Style.KnownColor = ExcelColors.LightYellow;
            sheet.Range["A6:B6"].Style.KnownColor = ExcelColors.LightOrange;
            sheet.Range["A7:B7"].Style.KnownColor = ExcelColors.LightYellow;
            sheet.Range["A8:B8"].Style.KnownColor = ExcelColors.LightOrange;
            sheet.Range["A9:B9"].Style.KnownColor = ExcelColors.LightYellow;
            sheet.Range["A10:B10"].Style.KnownColor = ExcelColors.LightOrange;

            sheet.Range["A2:B10"].Style.NumberFormat = "\"$\"#,##0";

            chart.Series[0].CategoryLabels = sheet.Range["A2:A10"];
            chart.Series[0].Values = sheet.Range["B2:B10"];

            chart.Series[0].TrendLines.Add(TrendLineType.Exponential);

            chart.PrimaryValueAxis.Title = "Salary";
            chart.PrimaryCategoryAxis.Title = "Car Price";

            workbook.SaveToFile("XYChart.xlsx", FileFormat.Version2013);
            System.Diagnostics.Process.Start("XYChart.xlsx");
        }
    }
}
How to Create Bubble Chart in PowerPoint in C#, VB.NET
A bubble chart is generally used to display the relationship between 3 parameters. For example, you can use bubble chart to show relation between Number of product, Sales volume and Market share. Unlike other charts, a bubble chart does not use a category axis - both horizontal and vertical axes are value axes.
As a powerful component, Spire.Presentation supports to insert various kinds of charts in PowerPoint including bubble chart. In this article, I made an example to show how to create bubble chart with custom data using Spire.Presentation in C#, VB.NET.
Main Steps:
Step 1: Initialize a new instance of Presentation class.
Presentation pres = new Presentation();
Step 2: Insert chart, set chart title and set the type of chart as Bubble.
RectangleF rect1 = new RectangleF(40, 40, 550, 320);
IChart chart = pres.Slides[0].Shapes.AppendChart(ChartType.Bubble, rect1, false);
chart.ChartTitle.TextProperties.Text = "Bubble Chart";
chart.ChartTitle.TextProperties.IsCentered = true;
chart.ChartTitle.Height = 30;
chart.HasTitle = true;
Step 3: Define a group of arrays.
Double[] xdata = new Double[] { 7.7, 8.9, 1.0, 2.4 };
Double[] ydata = new Double[] { 15.2, 5.3, 6.7, 8 };
Double[] size = new Double[] { 1.1, 2.4, 3.7, 4.8 };
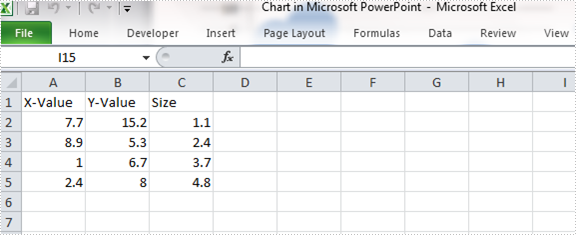
Step 4: Attach the data to chart. You can use the property chart.ChartData[rowIndex, columnIndex].Text to get/set the text value, use the property chart.ChartData[rowIndex, columnIndex].Value to get/set numeric value. Here I insert values in predefined arrays to the data chart.
chart.ChartData[0, 0].Text = "X-Value";
chart.ChartData[0, 1].Text = "Y-Value";
chart.ChartData[0, 2].Text = "Size";

for (Int32 i = 0; i < xdata.Length; ++i)
{
    chart.ChartData[i + 1, 0].Value = xdata[i];
    chart.ChartData[i + 1, 1].Value = ydata[i];
    chart.ChartData[i + 1, 2].Value = size[i];
}
Step 5: Set the Series label.
chart.Series.SeriesLabel = chart.ChartData["B1","B1"];
Step 6: Assign data to X axis, Y axis and Bubbles.
chart.Series[0].XValues = chart.ChartData["A2", "A5"];
chart.Series[0].YValues = chart.ChartData["B2", "B5"];
chart.Series[0].Bubbles.Add(chart.ChartData["C2"]);
chart.Series[0].Bubbles.Add(chart.ChartData["C3"]);
chart.Series[0].Bubbles.Add(chart.ChartData["C4"]);
chart.Series[0].Bubbles.Add(chart.ChartData["C5"]);
Step 7: Save and launch the file.
pres.SaveToFile(@"result.pptx", FileFormat.Pptx2010);
System.Diagnostics.Process.Start("result.pptx");
Output:
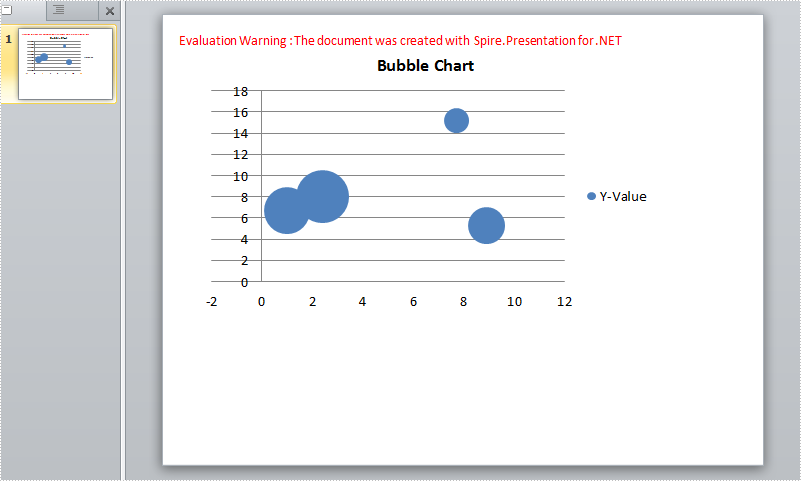
Chart data:
Full Code:
using Spire.Presentation;
using Spire.Presentation.Charts;
using System;
using System.Drawing;

     namespace CreateBubbleChart
{
    class Program
    {
        static void Main(string[] args)
        {
            Presentation pres = new Presentation();
            RectangleF rect1 = new RectangleF(40, 40, 550, 320);
            IChart chart = pres.Slides[0].Shapes.AppendChart(ChartType.Bubble, rect1, false);
            chart.ChartTitle.TextProperties.Text = "Bubble Chart";
            chart.ChartTitle.TextProperties.IsCentered = true;
            chart.ChartTitle.Height = 30;
            chart.HasTitle = true;

            Double[] xdata = new Double[] { 7.7, 8.9, 1.0, 2.4 };
            Double[] ydata = new Double[] { 15.2, 5.3, 6.7, 8 };
            Double[] size = new Double[] { 1.1, 2.4, 3.7, 4.8 };

            chart.ChartData[0, 0].Text = "X-Value";
            chart.ChartData[0, 1].Text = "Y-Value";
            chart.ChartData[0, 2].Text = "Size";

            for (Int32 i = 0; i < xdata.Length; ++i)
            {
                chart.ChartData[i + 1, 0].Value = xdata[i];
                chart.ChartData[i + 1, 1].Value = ydata[i];
                chart.ChartData[i + 1, 2].Value = size[i];
            }

            chart.Series.SeriesLabel = chart.ChartData["B1", "B1"];

            chart.Series[0].XValues = chart.ChartData["A2", "A5"];
            chart.Series[0].YValues = chart.ChartData["B2", "B5"];
            chart.Series[0].Bubbles.Add(chart.ChartData["C2"]);
            chart.Series[0].Bubbles.Add(chart.ChartData["C3"]);
            chart.Series[0].Bubbles.Add(chart.ChartData["C4"]);
            chart.Series[0].Bubbles.Add(chart.ChartData["C5"]);

            pres.SaveToFile(@"result.pptx", FileFormat.Pptx2010);
            System.Diagnostics.Process.Start("result.pptx");

        }
    }
}
Imports Spire.Presentation
Imports Spire.Presentation.Charts
Imports System.Drawing

Namespace CreateBubbleChart
	Class Program
		Private Shared Sub Main(args As String())
			Dim pres As New Presentation()
			Dim rect1 As New RectangleF(40, 40, 550, 320)
			Dim chart As IChart = pres.Slides(0).Shapes.AppendChart(ChartType.Bubble, rect1, False)
			chart.ChartTitle.TextProperties.Text = "Bubble Chart"
			chart.ChartTitle.TextProperties.IsCentered = True
			chart.ChartTitle.Height = 30
			chart.HasTitle = True

			Dim xdata As [Double]() = New [Double]() {7.7, 8.9, 1.0, 2.4}
			Dim ydata As [Double]() = New [Double]() {15.2, 5.3, 6.7, 8}
			Dim size As [Double]() = New [Double]() {1.1, 2.4, 3.7, 4.8}

			chart.ChartData(0, 0).Text = "X-Value"
			chart.ChartData(0, 1).Text = "Y-Value"
			chart.ChartData(0, 2).Text = "Size"

			For i As Int32 = 0 To xdata.Length - 1
				chart.ChartData(i + 1, 0).Value = xdata(i)
				chart.ChartData(i + 1, 1).Value = ydata(i)
				chart.ChartData(i + 1, 2).Value = size(i)
			Next

			chart.Series.SeriesLabel = chart.ChartData("B1", "B1")

			chart.Series(0).XValues = chart.ChartData("A2", "A5")
			chart.Series(0).YValues = chart.ChartData("B2", "B5")
			chart.Series(0).Bubbles.Add(chart.ChartData("C2"))
			chart.Series(0).Bubbles.Add(chart.ChartData("C3"))
			chart.Series(0).Bubbles.Add(chart.ChartData("C4"))
			chart.Series(0).Bubbles.Add(chart.ChartData("C5"))

			pres.SaveToFile("result.pptx", FileFormat.Pptx2010)
			System.Diagnostics.Process.Start("result.pptx")

		End Sub
	End Class
End Namespace
C#: Copy Slides in PowerPoint Presentations
If you are preparing a large number of presentations, cloning slides can help you save resources. Instead of creating new slides from scratch for each presentation, it is more efficient and less time-consuming to modify existing slides. In this article, you will learn how to copy slides in PowerPoint presentations in C# using Spire.Presentation for .NET.
Install Spire.Presentation for .NET
To begin with, you need to add the DLL files included in the Spire.Presentation for.NET package as references in your .NET project. The DLL files can be either downloaded from this link or installed via NuGet.
PM> Install-Package Spire.Presentation
Copy Slides Within the Same Presentation in C#
You can clone a slide either at a specified location or at the end of a PowerPoint presentation through the Presentation.Slides.Insert(intIndex, ISlide slide) or Presentation.Slides.Append(ISlide slide) methods. The following are the detailed steps.
- Create a Presentation instance.
- Load a PowerPoint presentation using Presentation.LoadFromFile() method.
- Get a specified slide using Prenstion.Slides[] property.
- Clone the slide to the end of the same presentation using Presentation.Slides.Append() method.
- Clone the slide to a specific position within the same presentation using Presentation.Slides.Insert() method.
- Save the result file using Presentation.SaveToFile() method.
- C#
using Spire.Presentation;

namespace CopySlides
{
    class Program
    {
        static void Main(string[] args)
        {
            //Create a Presentation instance
            Presentation ppt = new Presentation();

            //Load a PowerPoint presentation
            ppt.LoadFromFile("Input1.pptx");

            //Get the first slide in the presentation
            ISlide slide = ppt.Slides[0];

            //Clone the slide to the end of the presentation
            ppt.Slides.Append(slide);

            //Clone the slide to the third position within the presentation
            ppt.Slides.Insert(2, slide);

            //Save the result file
            ppt.SaveToFile("CloneSlidesWithinTheSame.pptx", FileFormat.Pptx2013);

        }
    }
}
Copy Slides to Another Presentation in C#
Spire.Presentation for .NET also allows you to load two PowerPoint files and then clone the slides from one presentation to another presentation. The following are the detailed steps.
- Create a Presentation instance.
- Load two PowerPoint presentations using Presentation.LoadFromFile() method.
- Get two slides in the first presentation using Prenstion.Slides[] property.
- Clone the first slide to a specific position in the second presentation using Presentation.Slides.Insert() method.
- Clone the second slide to the end of the second presentation using Presentation.Slides.Append() method.
- Save the result file using Presentation.SaveToFile() method.
- C#
using Spire.Presentation;

namespace CopySlidesToAnother
{
    class Program
    {
        static void Main(string[] args)
        {
            //Load the first PowerPoint presentation
            Presentation sourcePPT = new Presentation();
            sourcePPT.LoadFromFile("Input1.pptx");

            //Load the second PowerPoint presentation
            Presentation destPPT = new Presentation();
            destPPT.LoadFromFile("Input2.pptx");

            //Get two slides in the first presentation
            ISlide slide1 = sourcePPT.Slides[1];
            ISlide slide2 = sourcePPT.Slides[2];

            //Clone slide1 to the second position in the second presentation
            destPPT.Slides.Insert(1, slide1);

            //Clone slide2 to the end of the second presentation
            destPPT.Slides.Append(slide2);

            //Save the result file
            destPPT.SaveToFile("CloneSlidesToAnother.pptx", FileFormat.Pptx2013);

        }
    }
}
Apply for a Temporary License
If you'd like to remove the evaluation message from the generated documents, or to get rid of the function limitations, please request a 30-day trial license for yourself.
Add page numbers in different sections in Word document via Spire.Doc
Sometimes in one Word document developers need to add page numbers for different sections, for example cover, directory and content are in different sections. This article talks about how to add page numbers for different sections via Spire.Doc.
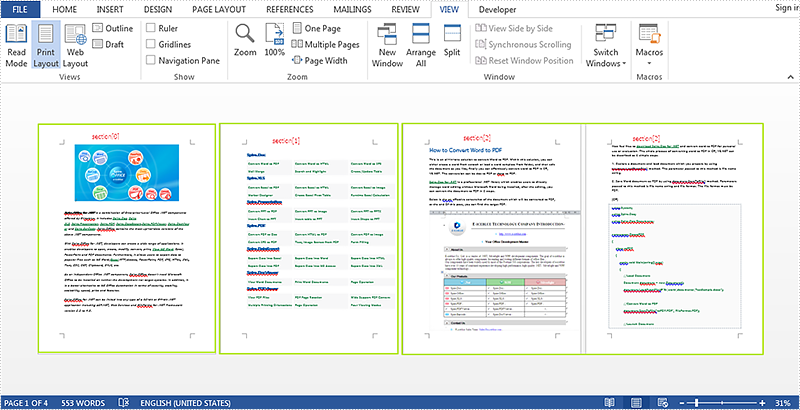
Here will import a test document within 3 sections inside as followed screenshot.
Here are the detailed steps:
Step 1: Create a new document and load the test word file.
Document document = new Document("test.docx");
Step 2: Create footer for the first section and add page number inside.
HeaderFooter footer = document.Sections[0].HeadersFooters.Footer;
Paragraph footerParagraph = footer.AddParagraph();
footerParagraph.AppendField("page number", FieldType.FieldPage);
footerParagraph.AppendText(" of ");
footerParagraph.AppendField("number of pages", FieldType.FieldSectionPages);
footerParagraph.Format.HorizontalAlignment = HorizontalAlignment.Right;
Step 3: Restart page number of next section and set the starting page number to 1.
document.Sections[1].PageSetup.RestartPageNumbering = true;
document.Sections[1].PageSetup.PageStartingNumber = 1;
Step 4: Repeat step2 and Step3 for the rest sections, so change the code with for loop.
for (int i = 0; i < 3; i++)
            {
                HeaderFooter footer = document.Sections[i].HeadersFooters.Footer;
                Paragraph footerParagraph = footer.AddParagraph();
                footerParagraph.AppendField("page number", FieldType.FieldPage);
                footerParagraph.AppendText(" of ");
                footerParagraph.AppendField("number of pages", FieldType.FieldSectionPages);
                footerParagraph.Format.HorizontalAlignment = HorizontalAlignment.Right;

                if (i == 2)
                    break;
                else
                {
                    document.Sections[i + 1].PageSetup.RestartPageNumbering = true;
                    document.Sections[i + 1].PageSetup.PageStartingNumber = 1;
                }
            }
Step 5: Save and review.
document.SaveToFile("result.docx", FileFormat.Docx);
System.Diagnostics.Process.Start("result.docx");
Result screenshot:
Only convert visible or hidden worksheet to image in C#
Spire.XLS supports to convert the whole excel workbook into Image, PDF, HTML and other files formats; it also supports to hide or show the worksheet in C#. When we have hidden worksheet in the excel files, developers can also use Spire.XLS to only convert the visible or hidden excel worksheets to other file formats by judge the property of WorksheetVisibility. This article will show you how to only convert visible or hidden worksheet to image in C#.
Here comes to the steps:
Step 1: Create a new document and load from file.
Workbook book = new Workbook();
book.LoadFromFile("sample.xlsx", ExcelVersion.Version2010);
Step 2: Traverse every worksheet in the excel file.
foreach (Spire.Xls.Worksheet ws2 in book.Worksheets)
Step 3: Call the property of WorksheetVisibility to judge visible or hidden excel worksheet.
//only converts the visible sheet
if (ws2.Visibility == WorksheetVisibility.Visible)
//only converts the hidden sheet
if (ws2.Visibility == WorksheetVisibility.Hidden)
Step 4: Use SaveToImage to convert Excel worksheet to Image.
ws2.SaveToImage("result.jpg");
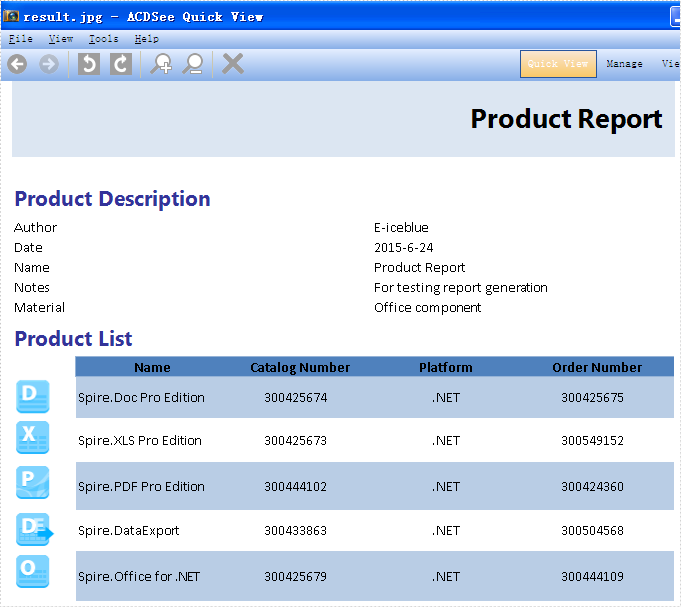
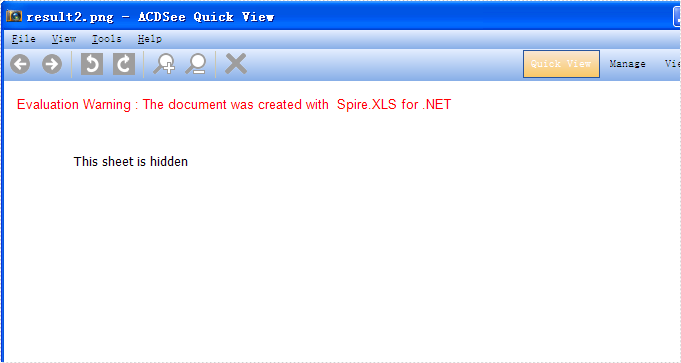
Effective screenshots:
Only convert the visible worksheet to Image in .jpg format.
Only convert the hidden worksheet to Image in .png format.
Full codes:
using Spire.Xls;
namespace Convert

{
    class Program
    {

       static void Main(string[] args)
        {

            Workbook book = new Workbook();
            book.LoadFromFile("sample.xlsx", ExcelVersion.Version2010);

            foreach (Spire.Xls.Worksheet ws2 in book.Worksheets)
            {
                //only convert the visible sheet
                if (ws2.Visibility == WorksheetVisibility.Visible)
                    ////only convert the hidden sheet
                    //if (ws2.Visibility == WorksheetVisibility.Hidden)
                    ws2.SaveToImage("result.jpg");
            }
        }
        }
    }
Add different first page header and footer
In the MS Word Header & Footer Tools options, we could choose "Different First Page" and "Different odd and even pages". The article "How to create different headers/footers for odd and even pages" introduces the method to set different odd and even pages using Spire.Doc. Spire.DOC also provides an easy and quick method to add different first page header & footer. This article is going to introduce the method to add different first page header & footer.
FYI, if you only need the first page header and footer, please just set the first page header & footer and leave the rest alone. In this way, your Word document will only have header & footer in the first page, which provides a simpler way to add a header only into the first page of a document than the method mentioned in the article "How to add a header only into the first page of a document".
Note: before start, please download the latest version of Spire.Doc and add Spire.Doc .dll in the bin folder as the reference of Visual Studio.
Step 1: Load the sample document that only contains text.
Document document = new Document();
document.LoadFromFile("T.docx");
Step 2: Get the section and set the property true.
Section section = document.Sections[0];
section.PageSetup.DifferentFirstPageHeaderFooter = true;
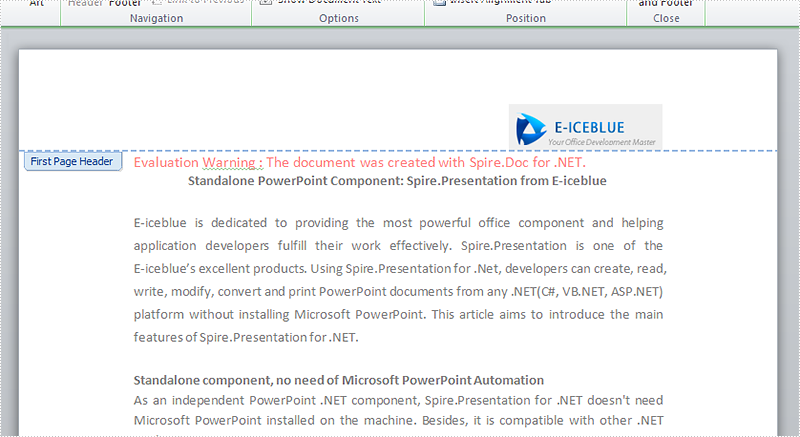
Step 3: Set the first page header. Here we append a picture as the header.
Paragraph paragraph1 = section.HeadersFooters.FirstPageHeader.AddParagraph();
paragraph1.Format.HorizontalAlignment = HorizontalAlignment.Right;
DocPicture headerimage = paragraph1.AppendPicture(Image.FromFile("2.bmp"));
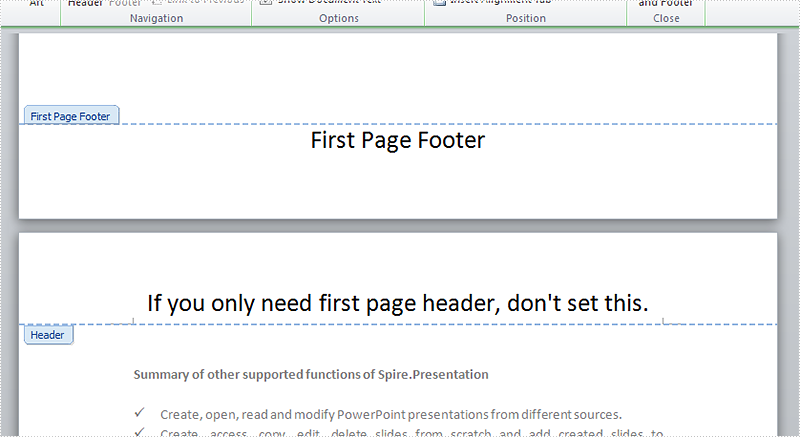
Step 4: Set the first page footer.
Paragraph paragraph2 = section.HeadersFooters.FirstPageFooter.AddParagraph();
paragraph2.Format.HorizontalAlignment = HorizontalAlignment.Center;
TextRange FF = paragraph2.AppendText("First Page Footer");
FF.CharacterFormat.FontSize = 20;
Step 5: Set the other header & footer. If you only need the first page header & footer, don't set this.
Paragraph paragraph3 = section.HeadersFooters.Header.AddParagraph();
paragraph3.Format.HorizontalAlignment = HorizontalAlignment.Center;
TextRange NH = paragraph3.AppendText("If you only need first page header, don't set this.");
NH.CharacterFormat.FontSize = 20;

Paragraph paragraph4 = section.HeadersFooters.Footer.AddParagraph();
paragraph4.Format.HorizontalAlignment = HorizontalAlignment.Center;
TextRange NF = paragraph4.AppendText("If you only need first page footer, don't set this.");
NF.CharacterFormat.FontSize = 20;
Step 6: save the document and launch to see effects.
document.SaveToFile("R.docx", FileFormat.Docx2010);
System.Diagnostics.Process.Start("R.docx");
Effects:
Full codes:
using System;
using System.Collections.Generic;
using System.Linq;
using System.Text;
using Spire.Doc;
using Spire.Doc.Documents;
using Spire.Doc.Fields;
using System.Drawing;

namespace Mirror_Margin
{
    class Program
    {
        static void Main(string[] args)
        {
            Document document = new Document();
            document.LoadFromFile("T.docx");

            Section section = document.Sections[0];
            section.PageSetup.DifferentFirstPageHeaderFooter = true;

            Paragraph paragraph1 = section.HeadersFooters.FirstPageHeader.AddParagraph();
            paragraph1.Format.HorizontalAlignment = HorizontalAlignment.Right;
            DocPicture headerimage = paragraph1.AppendPicture(Image.FromFile("2.bmp"));

            Paragraph paragraph2 = section.HeadersFooters.FirstPageFooter.AddParagraph();
            paragraph2.Format.HorizontalAlignment = HorizontalAlignment.Center;
            TextRange FF = paragraph2.AppendText("First Page Footer");
            FF.CharacterFormat.FontSize = 20;

            Paragraph paragraph3 = section.HeadersFooters.Header.AddParagraph();
            paragraph3.Format.HorizontalAlignment = HorizontalAlignment.Center;
            TextRange NH = paragraph3.AppendText("If you only need first page header, don't set this.");
            NH.CharacterFormat.FontSize = 20;

            Paragraph paragraph4 = section.HeadersFooters.Footer.AddParagraph();
            paragraph4.Format.HorizontalAlignment = HorizontalAlignment.Center;
            TextRange NF = paragraph4.AppendText("If you only need first page footer, don't set this.");
            NF.CharacterFormat.FontSize = 20;

            document.SaveToFile("R.docx", FileFormat.Docx2010);
            System.Diagnostics.Process.Start("R.docx");
        }
    }
}