How to add a data table to the chart in C#
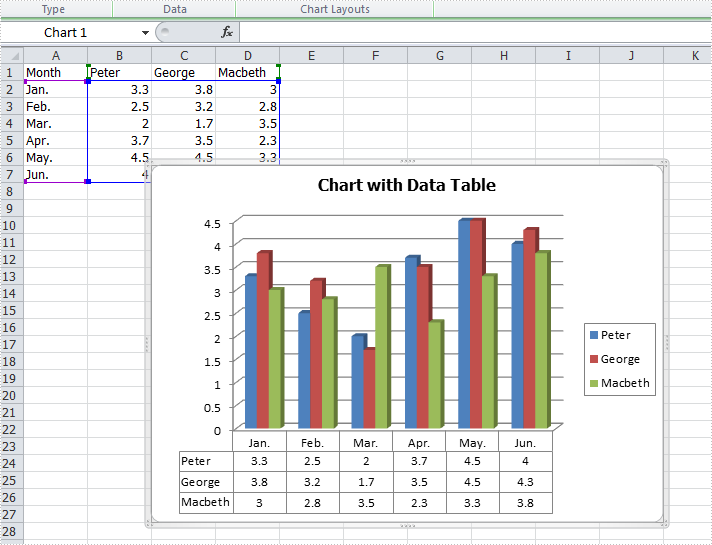
In Excel, we could use charts to visualize and compare data. However, once the charts are created, it becomes much difficult for us to read the data precisely from charts. Adding a data table below the chart is a good solution for which the chart and data are on the same place. This article is going to introduce the method to add a data table to the chart that is based on the data in C# using Spire.XLS.
Note: before start, please download the latest version of Spire.XLS and add the .dll in the bin folder as the reference of Visual studio.
Step 1: Create a new workbook and add an empty sheet.
            Workbook workbook = new Workbook();
            workbook.CreateEmptySheets(1);
            Worksheet sheet = workbook.Worksheets[0];
Step 2: Fill cells with sample data.
            sheet.Name = "Demo";
            sheet.Range["A1"].Value = "Month";
            sheet.Range["A2"].Value = "Jan.";
            sheet.Range["A3"].Value = "Feb.";
            sheet.Range["A4"].Value = "Mar.";
            sheet.Range["A5"].Value = "Apr.";
            sheet.Range["A6"].Value = "May.";
            sheet.Range["A7"].Value = "Jun.";
            sheet.Range["B1"].Value = "Peter";
            sheet.Range["B2"].NumberValue = 3.3;
            sheet.Range["B3"].NumberValue = 2.5;
            sheet.Range["B4"].NumberValue = 2.0;
            sheet.Range["B5"].NumberValue = 3.7;
            sheet.Range["B6"].NumberValue = 4.5;
            sheet.Range["B7"].NumberValue = 4.0;
            sheet.Range["C1"].Value = "George";
            sheet.Range["C2"].NumberValue = 3.8;
            sheet.Range["C3"].NumberValue = 3.2;
            sheet.Range["C4"].NumberValue = 1.7;
            sheet.Range["C5"].NumberValue = 3.5;
            sheet.Range["C6"].NumberValue = 4.5;
            sheet.Range["C7"].NumberValue = 4.3;
            sheet.Range["D1"].Value = "Macbeth";
            sheet.Range["D2"].NumberValue = 3.0;
            sheet.Range["D3"].NumberValue = 2.8;
            sheet.Range["D4"].NumberValue = 3.5;
            sheet.Range["D5"].NumberValue = 2.3;
            sheet.Range["D6"].NumberValue = 3.3;
            sheet.Range["D7"].NumberValue = 3.8;
Step 3: Create a Column3DClustered based on the sample data.
            Chart chart = sheet.Charts.Add(ExcelChartType.Column3DClustered);
            chart.DataRange = sheet.Range["B1:D7"];
            chart.SeriesDataFromRange = false;
            chart.TopRow = 7;
            chart.BottomRow = 28;
            chart.LeftColumn = 3;
            chart.RightColumn =11;
            chart.ChartTitle = "Chart with Data Table";
            chart.ChartTitleArea.IsBold = true;
            chart.ChartTitleArea.Size = 12;
            Spire.Xls.Charts.ChartSerie cs1 = chart.Series[0];
            cs1.CategoryLabels = sheet.Range["A2:A7"];
Step 4: Add a data table to the chart that is based on the data.
chart.HasDataTable = true;
Step 5: Save the document and launch to see effects.
            workbook.SaveToFile("S3.xlsx", ExcelVersion.Version2010);
            System.Diagnostics.Process.Start("S3.xlsx");
Effects:
Full codes:
using System;
using System.Collections.Generic;
using System.Linq;
using System.Text;
using Spire.Xls;
using System.Drawing;

namespace ConsoleApplication2
{
    class Program
    {
        static void Main(string[] args)
        {

            Workbook workbook = new Workbook();
            workbook.CreateEmptySheets(1);
            Worksheet sheet = workbook.Worksheets[0];

            sheet.Name = "Demo";
            sheet.Range["A1"].Value = "Month";
            sheet.Range["A2"].Value = "Jan.";
            sheet.Range["A3"].Value = "Feb.";
            sheet.Range["A4"].Value = "Mar.";
            sheet.Range["A5"].Value = "Apr.";
            sheet.Range["A6"].Value = "May.";
            sheet.Range["A7"].Value = "Jun.";
            sheet.Range["B1"].Value = "Peter";
            sheet.Range["B2"].NumberValue = 3.3;
            sheet.Range["B3"].NumberValue = 2.5;
            sheet.Range["B4"].NumberValue = 2.0;
            sheet.Range["B5"].NumberValue = 3.7;
            sheet.Range["B6"].NumberValue = 4.5;
            sheet.Range["B7"].NumberValue = 4.0;
            sheet.Range["C1"].Value = "George";
            sheet.Range["C2"].NumberValue = 3.8;
            sheet.Range["C3"].NumberValue = 3.2;
            sheet.Range["C4"].NumberValue = 1.7;
            sheet.Range["C5"].NumberValue = 3.5;
            sheet.Range["C6"].NumberValue = 4.5;
            sheet.Range["C7"].NumberValue = 4.3;
            sheet.Range["D1"].Value = "Macbeth";
            sheet.Range["D2"].NumberValue = 3.0;
            sheet.Range["D3"].NumberValue = 2.8;
            sheet.Range["D4"].NumberValue = 3.5;
            sheet.Range["D5"].NumberValue = 2.3;
            sheet.Range["D6"].NumberValue = 3.3;
            sheet.Range["D7"].NumberValue = 3.8;

            Chart chart = sheet.Charts.Add(ExcelChartType.Column3DClustered);
            chart.DataRange = sheet.Range["B1:D7"];
            chart.SeriesDataFromRange = false;
            chart.TopRow = 7;
            chart.BottomRow = 28;
            chart.LeftColumn = 3;
            chart.RightColumn =11;
            chart.ChartTitle = "Chart with Data Table";
            chart.ChartTitleArea.IsBold = true;
            chart.ChartTitleArea.Size = 12;
            Spire.Xls.Charts.ChartSerie cs1 = chart.Series[0];
            cs1.CategoryLabels = sheet.Range["A2:A7"];
            chart.HasDataTable = true;

            workbook.SaveToFile("S3.xlsx", ExcelVersion.Version2010);
            System.Diagnostics.Process.Start("S3.xlsx");
        }
    }
}
How to add error bars to a chart in C#
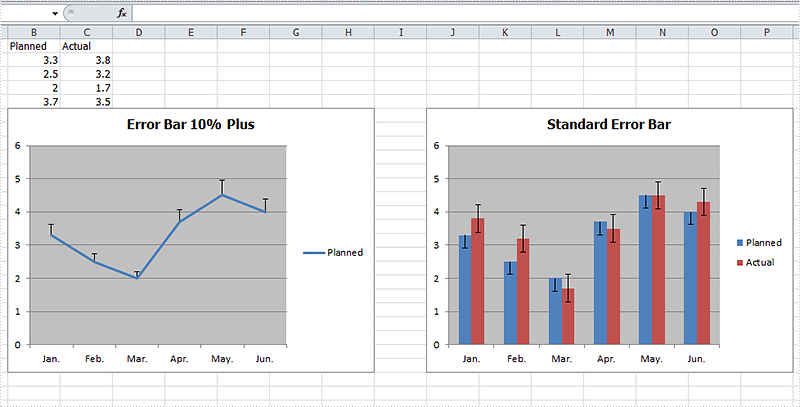
Error bars are a graphical representation of the variability of data and helps us see margins of error and standard deviations immediately in charts with a standard error amount, a percentage, a standard deviation or a custom error amount. Error bars can be used in 2-D area, bar, column, line, scatter, and bubble charts, which are all supported by Spire.XLS. This article is going to introduce the method to add error bars to a chart in C# using Spire.XLS.
Note: before start, please download the latest version of Spire.XLS and add the .dll in the bin folder as the reference of Visual Studio.
Step 1: Create a workbook and fill the sample data in sheet.
            Workbook workbook = new Workbook();
            workbook.CreateEmptySheets(1);
            Worksheet sheet = workbook.Worksheets[0];
            sheet.Name = "Demo";
            sheet.Range["A1"].Value = "Month";
            sheet.Range["A2"].Value = "Jan.";
            sheet.Range["A3"].Value = "Feb.";
            sheet.Range["A4"].Value = "Mar.";
            sheet.Range["A5"].Value = "Apr.";
            sheet.Range["A6"].Value = "May.";
            sheet.Range["A7"].Value = "Jun.";
            sheet.Range["B1"].Value = "Planned";
            sheet.Range["B2"].NumberValue = 3.3;
            sheet.Range["B3"].NumberValue = 2.5;
            sheet.Range["B4"].NumberValue = 2.0;
            sheet.Range["B5"].NumberValue = 3.7;
            sheet.Range["B6"].NumberValue = 4.5;
            sheet.Range["B7"].NumberValue = 4.0;
            sheet.Range["C1"].Value = "Actual";
            sheet.Range["C2"].NumberValue = 3.8;
            sheet.Range["C3"].NumberValue = 3.2;
            sheet.Range["C4"].NumberValue = 1.7;
            sheet.Range["C5"].NumberValue = 3.5;
            sheet.Range["C6"].NumberValue = 4.5;
            sheet.Range["C7"].NumberValue = 4.3;
Step 2: Add a line chart and then add percentage error bar to the chart. The direction of error bars can be set as both, minus and plus and the type of error bars can be set as fixed value, percentage, standard deviation, standard error or custom. After setting the direction and type, we can set the amount.
            Chart chart = sheet.Charts.Add(ExcelChartType.Line);
            chart.DataRange = sheet.Range["B1:B7"];
            chart.SeriesDataFromRange = false;
            chart.TopRow = 6;
            chart.BottomRow = 25;
            chart.LeftColumn = 2;
            chart.RightColumn = 9;
            chart.ChartTitle = "Error Bar 10% Plus";
            chart.ChartTitleArea.IsBold = true;
            chart.ChartTitleArea.Size = 12;
            Spire.Xls.Charts.ChartSerie cs1 = chart.Series[0];
            cs1.CategoryLabels = sheet.Range["A2:A7"];
            cs1.ErrorBar(true, ErrorBarIncludeType.Plus, ErrorBarType.Percentage,10);
Step 3: Add a column chart with standard error bars as comparison.
            Chart chart2 = sheet.Charts.Add(ExcelChartType.ColumnClustered);
            chart2.DataRange = sheet.Range["B1:C7"];
            chart2.SeriesDataFromRange = false;
            chart2.TopRow = 6;
            chart2.BottomRow = 25;
            chart2.LeftColumn = 10;
            chart2.RightColumn = 17;
            chart2.ChartTitle = "Standard Error Bar";
            chart2.ChartTitleArea.IsBold = true;
            chart2.ChartTitleArea.Size = 12;
            Spire.Xls.Charts.ChartSerie cs2 = chart2.Series[0];
            cs2.CategoryLabels = sheet.Range["A2:A7"];
            cs2.ErrorBar(true, ErrorBarIncludeType.Minus, ErrorBarType.StandardError, 0.3);
            Spire.Xls.Charts.ChartSerie cs3 = chart2.Series[1];
            cs3.ErrorBar(true, ErrorBarIncludeType.Both, ErrorBarType.StandardError, 0.5);
Step 4: Save the document and launch to see effects.
            workbook.SaveToFile("S3.xlsx", ExcelVersion.Version2010);
            System.Diagnostics.Process.Start("S3.xlsx");
Effects:
Full Codes:
using System;
using System.Collections.Generic;
using System.Linq;
using System.Text;
using Spire.Xls;
using System.Drawing;

namespace ConsoleApplication2
{
    class Program
    {
        static void Main(string[] args)
        {

            Workbook workbook = new Workbook();
            workbook.CreateEmptySheets(1);
            Worksheet sheet = workbook.Worksheets[0];
            sheet.Name = "Demo";
            sheet.Range["A1"].Value = "Month";
            sheet.Range["A2"].Value = "Jan.";
            sheet.Range["A3"].Value = "Feb.";
            sheet.Range["A4"].Value = "Mar.";
            sheet.Range["A5"].Value = "Apr.";
            sheet.Range["A6"].Value = "May.";
            sheet.Range["A7"].Value = "Jun.";
            sheet.Range["B1"].Value = "Planned";
            sheet.Range["B2"].NumberValue = 3.3;
            sheet.Range["B3"].NumberValue = 2.5;
            sheet.Range["B4"].NumberValue = 2.0;
            sheet.Range["B5"].NumberValue = 3.7;
            sheet.Range["B6"].NumberValue = 4.5;
            sheet.Range["B7"].NumberValue = 4.0;
            sheet.Range["C1"].Value = "Actual";
            sheet.Range["C2"].NumberValue = 3.8;
            sheet.Range["C3"].NumberValue = 3.2;
            sheet.Range["C4"].NumberValue = 1.7;
            sheet.Range["C5"].NumberValue = 3.5;
            sheet.Range["C6"].NumberValue = 4.5;
            sheet.Range["C7"].NumberValue = 4.3;

            Chart chart = sheet.Charts.Add(ExcelChartType.Line);
            chart.DataRange = sheet.Range["B1:B7"];
            chart.SeriesDataFromRange = false;
            chart.TopRow = 6;
            chart.BottomRow = 25;
            chart.LeftColumn = 2;
            chart.RightColumn = 9;
            chart.ChartTitle = "Error Bar 10% Plus";
            chart.ChartTitleArea.IsBold = true;
            chart.ChartTitleArea.Size = 12;
            Spire.Xls.Charts.ChartSerie cs1 = chart.Series[0];
            cs1.CategoryLabels = sheet.Range["A2:A7"];
            cs1.ErrorBar(true, ErrorBarIncludeType.Plus, ErrorBarType.Percentage,10);

            Chart chart2 = sheet.Charts.Add(ExcelChartType.ColumnClustered);
            chart2.DataRange = sheet.Range["B1:C7"];
            chart2.SeriesDataFromRange = false;
            chart2.TopRow = 6;
            chart2.BottomRow = 25;
            chart2.LeftColumn = 10;
            chart2.RightColumn = 17;
            chart2.ChartTitle = "Standard Error Bar";
            chart2.ChartTitleArea.IsBold = true;
            chart2.ChartTitleArea.Size = 12;
            Spire.Xls.Charts.ChartSerie cs2 = chart2.Series[0];
            cs2.CategoryLabels = sheet.Range["A2:A7"];
            cs2.ErrorBar(true, ErrorBarIncludeType.Minus, ErrorBarType.StandardError, 0.3);
            Spire.Xls.Charts.ChartSerie cs3 = chart2.Series[1];
            cs3.ErrorBar(true, ErrorBarIncludeType.Both, ErrorBarType.StandardError, 0.5);

            workbook.SaveToFile("S3.xlsx", ExcelVersion.Version2010);
            System.Diagnostics.Process.Start("S3.xlsx");

        }
    }
}
How to Add an Image to Slide Master in C#, VB.NET
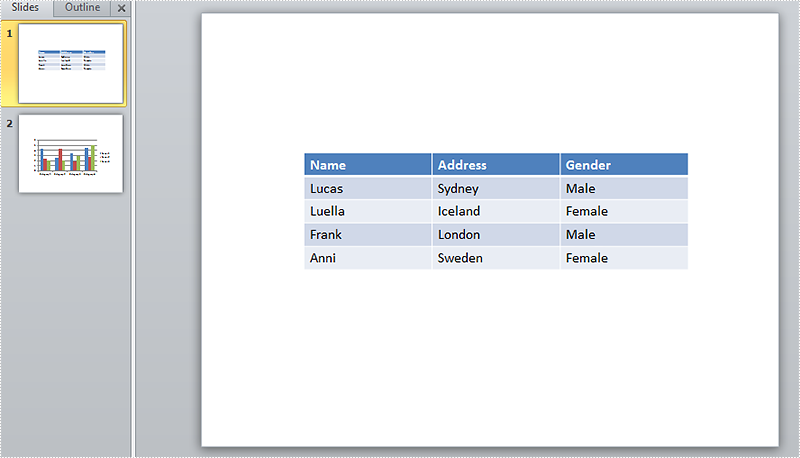
A slide master is the top slide that stores the information about the theme and slide layouts, which will be inherited by other slides in the presentation. In other words, when you modify the style of slide master, every slide in the presentation will be changed accordingly, including the ones added later.
This quality makes it possible that when you want to insert an image or watermark to every slide, you only need to insert the image in slide master. In this article, you'll learn how to add an image to slide master using Spire.Presenation in C#, VB.NET.
Screenshot of original file:
Detailed Steps:
Step 1: Initialize a new Presentation and load the sample file
Presentation presentation = new Presentation();
presentation.LoadFromFile(@"sample.pptx");
Step 2: Get the master collection.
IMasterSlide master = presentation.Masters[0];
Step 3: Insert an image to slide master.
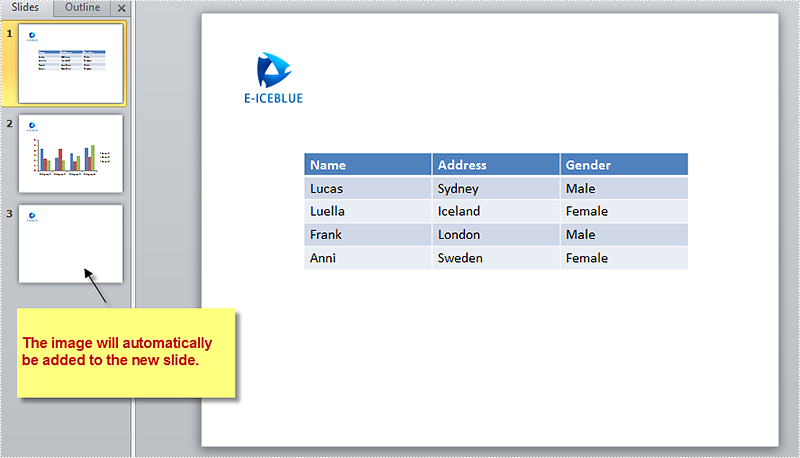
String image = @"logo.png";
RectangleF rff = new RectangleF(40, 40, 100, 80);
IEmbedImage pic=master.Shapes.AppendEmbedImage(ShapeType.Rectangle, image, rff);
pic.Line.FillFormat.FillType = FillFormatType.None;
Step 4: Add a new blank slide to the presentation.
presentation.Slides.Append();
Step 5: Save and launch the file.
presentation.SaveToFile("result.pptx", FileFormat.Pptx2010);
System.Diagnostics.Process.Start("result.pptx");
Output:
Full Code:
using Spire.Presentation;
using Spire.Presentation.Drawing;
using System;
using System.Drawing;

namespace AddImage
{

    class Program
    {

        static void Main(string[] args)
        {
            //initialize a new Presentation and load the sample file
            Presentation presentation = new Presentation();
            presentation.LoadFromFile(@"sample.pptx");
            //get the master collection
            IMasterSlide master = presentation.Masters[0];
            //append image to slide master
            String image = @"logo.png";
            RectangleF rff = new RectangleF(40, 40, 100, 80);
            IEmbedImage pic = master.Shapes.AppendEmbedImage(ShapeType.Rectangle, image, rff);
            pic.Line.FillFormat.FillType = FillFormatType.None;
            //add new slide to presentation
            presentation.Slides.Append();
            //save and launch the file
            presentation.SaveToFile("result.pptx", FileFormat.Pptx2010);
            System.Diagnostics.Process.Start("result.pptx");
        }
    }
}
Imports Spire.Presentation
Imports Spire.Presentation.Drawing
Imports System.Drawing

Namespace AddImage

	Class Program

		Private Shared Sub Main(args As String())
			'initialize a new Presentation and load the sample file
			Dim presentation As New Presentation()
			presentation.LoadFromFile("sample.pptx")
			'get the master collection
			Dim master As IMasterSlide = presentation.Masters(0)
			'append image to slide master
			Dim image As [String] = "logo.png"
			Dim rff As New RectangleF(40, 40, 100, 80)
			Dim pic As IEmbedImage = master.Shapes.AppendEmbedImage(ShapeType.Rectangle, image, rff)
			pic.Line.FillFormat.FillType = FillFormatType.None
			'add new slide to presentation
			presentation.Slides.Append()
			'save and launch the file
			presentation.SaveToFile("result.pptx", FileFormat.Pptx2010)
			System.Diagnostics.Process.Start("result.pptx")
		End Sub
	End Class
End Namespace
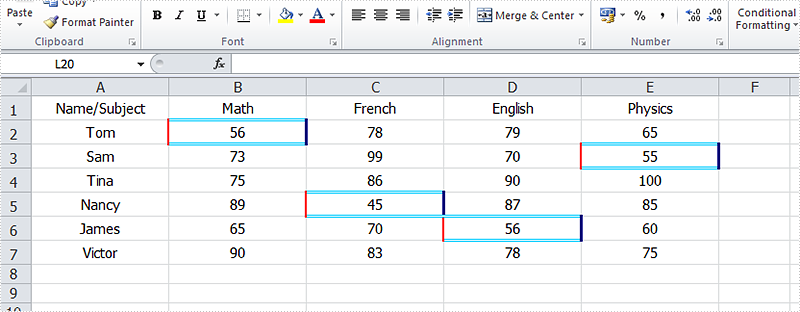
How to format cells with borders in conditional formatting
Using conditional formatting in Excel, we could highlight interesting cells, emphasize unusual values and visualize data with Data Bars, Color Scales and Icon Sets based on criteria. In the two articles Alternate Row Colors in Excel with Conditional Formatting and Apply Conditional Formatting to a Data Range, we have introduce the method to set fill, font, data bars, color scales and icon sets in conditional formatting using Spire.XLS. This article is going to introduce the method to format cells with borders in conditional formatting.
Note: before start, please download the latest version of Spire.XLS and add the .dll in the bin folder as the reference of Visual Studio.
Step 1: Create a new workbook and add sample data.
            Workbook workbook = new Workbook();
            Worksheet sheet = workbook.Worksheets[0];

            sheet.Range["A1"].Value = "Name/Subject";
            sheet.Range["A2"].Value = "Tom";
            sheet.Range["A3"].Value = "Sam";
            sheet.Range["A4"].Value = "Tina";
            sheet.Range["A5"].Value = "Nancy";
            sheet.Range["A6"].Value = "James";
            sheet.Range["A7"].Value = "Victor";
            sheet.Range["B1"].Value = "Math";
            sheet.Range["C1"].Value = "French";
            sheet.Range["D1"].Value = "English";
            sheet.Range["E1"].Value = "Physics";
            sheet.Range["B2"].NumberValue = 56;
            sheet.Range["B3"].NumberValue = 73;
            sheet.Range["B4"].NumberValue = 75;
            sheet.Range["B5"].NumberValue = 89;
            sheet.Range["B6"].NumberValue = 65;
            sheet.Range["B7"].NumberValue = 90;
            sheet.Range["C2"].NumberValue = 78;
            sheet.Range["C3"].NumberValue = 99;
            sheet.Range["C4"].NumberValue = 86;
            sheet.Range["C5"].NumberValue = 45;
            sheet.Range["C6"].NumberValue = 70;
            sheet.Range["C7"].NumberValue = 83;
            sheet.Range["D2"].NumberValue = 79;
            sheet.Range["D3"].NumberValue = 70;
            sheet.Range["D4"].NumberValue = 90;
            sheet.Range["D5"].NumberValue = 87;
            sheet.Range["D6"].NumberValue = 56;
            sheet.Range["D7"].NumberValue = 78;
            sheet.Range["E2"].NumberValue = 65;
            sheet.Range["E3"].NumberValue = 55;
            sheet.Range["E4"].NumberValue = 100;
            sheet.Range["E5"].NumberValue = 85;
            sheet.Range["E6"].NumberValue = 60;
            sheet.Range["E7"].NumberValue = 75;

            sheet.AllocatedRange.RowHeight = 17;
            sheet.AllocatedRange.ColumnWidth = 17;
            sheet.AllocatedRange.VerticalAlignment = VerticalAlignType.Center;
            sheet.AllocatedRange.HorizontalAlignment = HorizontalAlignType.Center;
Step 2: Set the formatting rule using formula. Here the rule is the number values less than 60.
            ConditionalFormatWrapper format1 = sheet.Range["B2:E7"].ConditionalFormats.AddCondition();
            format1.FirstFormula = "60";
            format1.Operator = ComparisonOperatorType.Less;
Step 3: Set border colors and styles for cells that match the condition.
            format1.LeftBorderColor = Color.Red;
            format1.RightBorderColor = Color.DarkBlue;
            format1.TopBorderColor = Color.DeepSkyBlue;
            format1.BottomBorderColor = Color.DeepSkyBlue;

            format1.LeftBorderStyle = LineStyleType.Medium;
            format1.RightBorderStyle = LineStyleType.Thick;
            format1.TopBorderStyle = LineStyleType.Double;
            format1.BottomBorderStyle = LineStyleType.Double;
Step 4: Save the document and launch to see effects.
            workbook.SaveToFile("sample.xlsx", ExcelVersion.Version2010);
            System.Diagnostics.Process.Start("sample.xlsx");
Effects:
Full Codes:
using System;
using System.Collections.Generic;
using System.Linq;
using System.Text;
using Spire.Xls;
using System.Drawing;

namespace Test
{
    class Program
    {
        static void Main(string[] args)
        {
            Workbook workbook = new Workbook();
            Worksheet sheet = workbook.Worksheets[0];

            sheet.Range["A1"].Value = "Name/Subject";
            sheet.Range["A2"].Value = "Tom";
            sheet.Range["A3"].Value = "Sam";
            sheet.Range["A4"].Value = "Tina";
            sheet.Range["A5"].Value = "Nancy";
            sheet.Range["A6"].Value = "James";
            sheet.Range["A7"].Value = "Victor";
            sheet.Range["B1"].Value = "Math";
            sheet.Range["C1"].Value = "French";
            sheet.Range["D1"].Value = "English";
            sheet.Range["E1"].Value = "Physics";
            sheet.Range["B2"].NumberValue = 56;
            sheet.Range["B3"].NumberValue = 73;
            sheet.Range["B4"].NumberValue = 75;
            sheet.Range["B5"].NumberValue = 89;
            sheet.Range["B6"].NumberValue = 65;
            sheet.Range["B7"].NumberValue = 90;
            sheet.Range["C2"].NumberValue = 78;
            sheet.Range["C3"].NumberValue = 99;
            sheet.Range["C4"].NumberValue = 86;
            sheet.Range["C5"].NumberValue = 45;
            sheet.Range["C6"].NumberValue = 70;
            sheet.Range["C7"].NumberValue = 83;
            sheet.Range["D2"].NumberValue = 79;
            sheet.Range["D3"].NumberValue = 70;
            sheet.Range["D4"].NumberValue = 90;
            sheet.Range["D5"].NumberValue = 87;
            sheet.Range["D6"].NumberValue = 56;
            sheet.Range["D7"].NumberValue = 78;
            sheet.Range["E2"].NumberValue = 65;
            sheet.Range["E3"].NumberValue = 55;
            sheet.Range["E4"].NumberValue = 100;
            sheet.Range["E5"].NumberValue = 85;
            sheet.Range["E6"].NumberValue = 60;
            sheet.Range["E7"].NumberValue = 75;

            sheet.AllocatedRange.RowHeight = 17;
            sheet.AllocatedRange.ColumnWidth = 17;
            sheet.AllocatedRange.VerticalAlignment = VerticalAlignType.Center;
            sheet.AllocatedRange.HorizontalAlignment = HorizontalAlignType.Center;

            ConditionalFormatWrapper format1 = sheet.Range["B2:E7"].ConditionalFormats.AddCondition();
            format1.FirstFormula = "60";
            format1.Operator = ComparisonOperatorType.Less;

            format1.LeftBorderColor = Color.Red;
            format1.RightBorderColor = Color.DarkBlue;
            format1.TopBorderColor = Color.DeepSkyBlue;
            format1.BottomBorderColor = Color.DeepSkyBlue;

            format1.LeftBorderStyle = LineStyleType.Medium;
            format1.RightBorderStyle = LineStyleType.Thick;
            format1.TopBorderStyle = LineStyleType.Double;
            format1.BottomBorderStyle = LineStyleType.Double;

            workbook.SaveToFile("sample.xlsx", ExcelVersion.Version2010);
            System.Diagnostics.Process.Start("sample.xlsx");

        }
    }
}
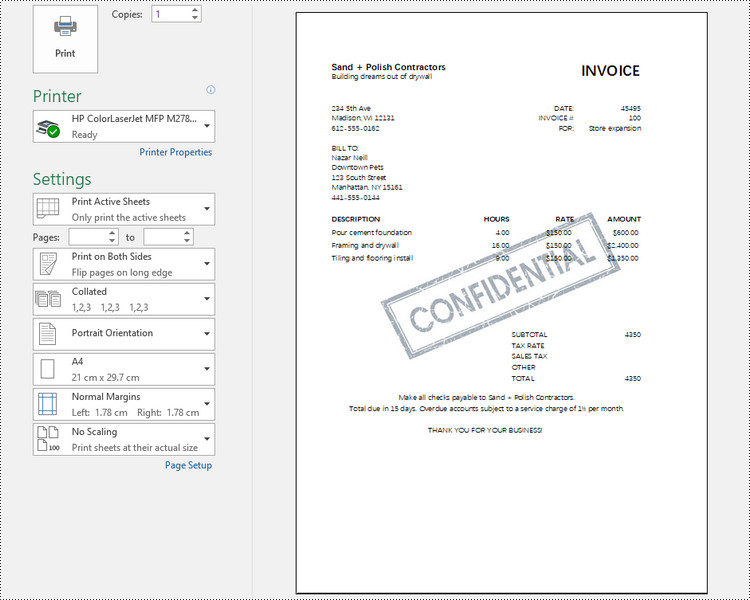
C#: Add a Watermark to an Excel Document
Adding a watermark to an Excel spreadsheet can be a useful way to brand your documents or indicate confidentiality. MS Excel does not provide a built-in feature to insert a watermark, however, there are ways to mimic the watermark effect by inserting an image into the header or footer of your Excel worksheet, or setting an image as the background of your spreadsheet.
In this article, you will learn how to add a header or background image watermark to Excel in C# using Spire.XLS for .NET.
Install Spire.XLS for .NET
To begin with, you need to add the DLL files included in the Spire.XLS for .NET package as references in your .NET project. The DLL files can be either downloaded from this link or installed via NuGet.
PM> Install-Package Spire.XLS
Header vs. Background Image Watermark
Header Image Watermark
Advantages:
- The watermark is preserved on the printed sheet, ensuring it appears in the final output.
Disadvantages:
- The watermark is invisible under the "Normal" view mode in Excel, only becoming visible in "Page Layout" or "Page Break Preview" views.
- To centrally position the watermark graphic on the Excel page, you need to carefully adjust the white margins, especially on the top and left sides of the image.
Background Image Watermark
Advantages:
- The watermark image covers the entire worksheet area, providing a consistent background appearance.
Disadvantages:
- The watermark is not preserved on the printed sheet, meaning it will not appear in the final printed output.
Add a Watermark to Excel Using a Header Image in C#
Spire.XLS for .NET provides the PageSetup class, which allows you to control various settings related to the appearance and layout of the printed worksheet. This class includes the CenterHeader and CenterHeaderImage properties, which enable you to set an image for the center section of the header.
Below are the steps to add a watermark to Excel using a header image in C#.
- Create a Workbook object.
- Load an Excel document from a give file path.
- Load an image using Image.FromFile() method.
- Get a specific worksheet from the workbook.
- Add an image field to the header center by setting Worksheet.PageSetup.CenterHeader property to "&G".
- Apply the image to the header center through Worksheet.PageSetup.CenterHeaderImage property.
- Save the workbook to a different Excel file.
- C#
using Spire.Xls;
using System.Drawing;

namespace AddWatermarkToExcelUsingHeader
{
    class Program
    {
        static void Main(string[] args)
        {
            // Create a Workbook object
            Workbook workbook = new Workbook();

            // Load an Excel document
            workbook.LoadFromFile("C:\\Users\\Administrator\\Desktop\\Input.xlsx");

            // Load an image file
            Image image = Image.FromFile("C:\\Users\\Administrator\\Desktop\\confidential.png");

            // Loop through all worksheets in the file
            for (int i = 0; i < workbook.Worksheets.Count; i++)
            {
                // Get a specific worksheet
                Worksheet worksheet = workbook.Worksheets[i];

                // Add an image field to the header center
                worksheet.PageSetup.CenterHeader = "&G";

                // Add the image to the header center
                worksheet.PageSetup.CenterHeaderImage = image;
            }

            // Save the result file
            workbook.SaveToFile("AddWatermark.xlsx", ExcelVersion.Version2016);

            // Dispose resources
            workbook.Dispose();
        }
    }
}
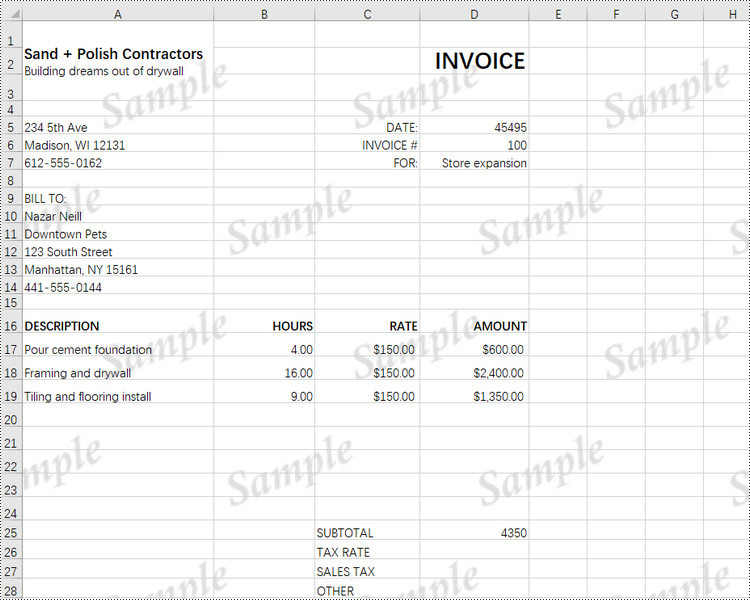
Add a Watermark to Excel Using a Background Image in C#
The PageSetup class also includes a property named BackgroundImage, which allows you to get or set the image used for the worksheet background.
Here are the steps to add a watermark to Excel using a background image in C#.
- Create a Workbook object.
- Load an Excel document from a give file path.
- Load an image file and convert it into a Bitmap image.
- Get a specific worksheet from the workbook.
- Apply the image to the worksheet as the background through Worksheet.PageSetup.BackgroundImage property.
- Save the workbook to a different Excel file.
- C#
using Spire.Xls;
using System.Drawing;

namespace AddWatermarkToExcelUsingBackground
{
    class Program
    {
        static void Main(string[] args)
        {
            // Create a Workbook object
            Workbook workbook = new Workbook();

            // Load an Excel document
            workbook.LoadFromFile("C:\\Users\\Administrator\\Desktop\\Input.xlsx");

            // Load an image file
            Bitmap bitmapImage = new Bitmap(Image.FromFile("C:\\Users\\Administrator\\Desktop\\sample.png"));

            // Loop through all worksheets in the file
            for (int i = 0; i < workbook.Worksheets.Count; i++)
            {
                // Get a specific worksheet
                Worksheet worksheet = workbook.Worksheets[i];

                // Set the image as the background of the worksheet
                worksheet.PageSetup.BackgoundImage = bitmapImage;
            }

            // Save the result file
            workbook.SaveToFile("AddWatermark.xlsx", ExcelVersion.Version2016);

            // Dispose resources
            workbook.Dispose();
        }
    }
}
Apply for a Temporary License
If you'd like to remove the evaluation message from the generated documents, or to get rid of the function limitations, please request a 30-day trial license for yourself.
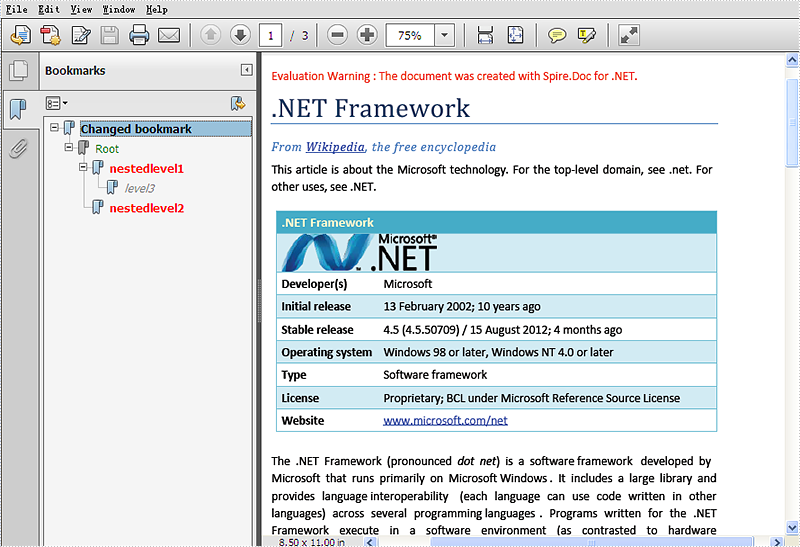
Set the color for different levels bookmark in word documents
We have already demonstrated how to insert single bookmark to word document by using Spire.Doc. When you need to insert many bookmarks to long word document, you can also use Spire.Doc to add multiple levels bookmarks and set different colors for them. Spire.Doc Version 5.5.71 adds a new method of BookmarkLayout to enable developers to set the different color for the different levels of bookmarks. This article will show you how to set the different color for the different levels of bookmarks.
Here comes to the code snippet:
Step 1: Create a new word document and load a file with nested level bookmarks.
Document document = new Document();
document.LoadFromFile("sample.docx");
Step 2: Save the word document into PDF to view the effects clearly and add the event of BookmarkLayout before saving to PDF.
ToPdfParameterList toPdf = new ToPdfParameterList();
toPdf.CreateWordBookmarks = true;
toPdf.WordBookmarksTitle = "Changed bookmark";
toPdf.WordBookmarksColor = Color.Gray;

//the event of BookmarkLayout occurs when draw a bookmark
document.BookmarkLayout += new Spire.Doc.Documents.Rendering.BookmarkLevelHandler(document_BookmarkLayout);

document.SaveToFile("result.pdf", toPdf);
Step 3: Call the method of BookmarkLayout to set the different color for the different levels of bookmarks.
static void document_BookmarkLayout(object sender, Spire.Doc.Documents.Rendering.BookmarkLevelEventArgs args)
{

    //set the different color for different levels of bookmarks
    if (args.BookmarkLevel.Level == 2)
    {
        args.BookmarkLevel.Color = Color.Red;
        args.BookmarkLevel.Style = BookmarkTextStyle.Bold;
    }
    else if (args.BookmarkLevel.Level == 3)
    {
        args.BookmarkLevel.Color = Color.Gray;
        args.BookmarkLevel.Style = BookmarkTextStyle.Italic;
    }
    else
    {
        args.BookmarkLevel.Color = Color.Green;
        args.BookmarkLevel.Style = BookmarkTextStyle.Regular;
    }
Please check the effective screenshot of multiple levels bookmarks with different colors:
Full codes:
using Spire.Doc;
using System.Drawing;
namespace SetColor
{
    class Program
    {

        static void Main(string[] args)
        {

            Document document = new Document();
            document.LoadFromFile("sample.docx");

            ToPdfParameterList toPdf = new ToPdfParameterList();
            toPdf.CreateWordBookmarks = true;
            toPdf.WordBookmarksTitle = "Changed bookmark";
            toPdf.WordBookmarksColor = Color.Gray;

            //the event of BookmarkLayout occurs when draw a bookmark
            document.BookmarkLayout += new Spire.Doc.Documents.Rendering.BookmarkLevelHandler(document_BookmarkLayout);

            document.SaveToFile("result.pdf", toPdf);
        }
        static void document_BookmarkLayout(object sender, Spire.Doc.Documents.Rendering.BookmarkLevelEventArgs args)
        {

            if (args.BookmarkLevel.Level == 2)
            {
                args.BookmarkLevel.Color = Color.Red;
                args.BookmarkLevel.Style = BookmarkTextStyle.Bold;
            }
            else if (args.BookmarkLevel.Level == 3)
            {
                args.BookmarkLevel.Color = Color.Gray;
                args.BookmarkLevel.Style = BookmarkTextStyle.Italic;
            }
            else
            {
                args.BookmarkLevel.Color = Color.Green;
                args.BookmarkLevel.Style = BookmarkTextStyle.Regular;
            }
        }
    }
}
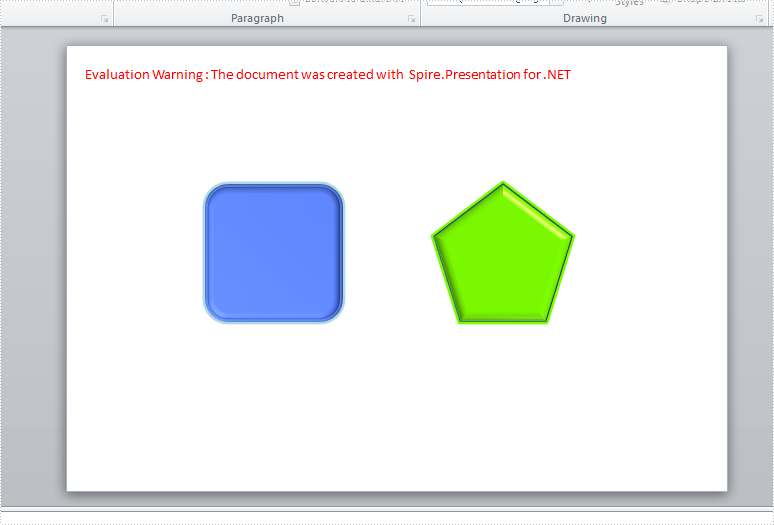
How to set 3-D format for shapes in slides
3-D is the abbreviation for three-dimensional. After adding a shape into the slide, we could set its format as 3-D, which looks more fresh and attractive. We could use options like Bevel, Contours, and Surface Material to customize 3-D shapes. This article is going to introduce the method to set 3-D shapes in C# using Spire.Presentation.
Note: before start, please download the latest version of Spire.Presentation and add the .dll in the bin folder as the reference of Visual Studio.
Step 1: Create a new presentation document.
Presentation presentation = new Presentation();
Step 2: Add shape1 and fill it with color.
IAutoShape shape1 = presentation.Slides[0].Shapes.AppendShape(ShapeType.RoundCornerRectangle, new RectangleF(150, 150, 150, 150));
shape1.Fill.FillType = FillFormatType.Solid;
shape1.Fill.SolidColor.KnownColor = KnownColors.RoyalBlue;
Step 3: Initialize a new instance of the 3-D class for shape1 and set its properties.
            ShapeThreeD Demo1 = shape1.ThreeD.ShapeThreeD;
            Demo1.PresetMaterial = PresetMaterialType.Powder;
            Demo1.TopBevel.PresetType = BevelPresetType.ArtDeco;
            Demo1.TopBevel.Height = 4;
            Demo1.TopBevel.Width = 12;
            Demo1.BevelColorMode = BevelColorType.Contour;
            Demo1.ContourColor.KnownColor = KnownColors.LightBlue;
            Demo1.ContourWidth = 3.5;
Step 4: Set 3-D format for shape2 as comparison.
IAutoShape shape2 = presentation.Slides[0].Shapes.AppendShape(ShapeType.Pentagon, new RectangleF(400, 150, 150, 150));
           shape2.Fill.FillType = FillFormatType.Solid;
           shape2.Fill.SolidColor.KnownColor = KnownColors.LawnGreen;
           ShapeThreeD Demo2 = shape2.ThreeD.ShapeThreeD;
           Demo2.PresetMaterial = PresetMaterialType.SoftEdge;
           Demo2.TopBevel.PresetType = BevelPresetType.SoftRound;
           Demo2.TopBevel.Height = 12;
           Demo2.TopBevel.Width = 12;
           Demo2.BevelColorMode = BevelColorType.Contour;
           Demo2.ContourColor.KnownColor = KnownColors.LawnGreen;
           Demo2.ContourWidth = 5;
Step 5: Save the document and launch to see effects.
           presentation.SaveToFile("result.pptx", FileFormat.Pptx2010);
           System.Diagnostics.Process.Start("result.pptx");
Effects:
Full Codes:
using System;
using System.Collections.Generic;
using System.Linq;
using System.Text;
using Spire.Presentation;
using Spire.Presentation.Drawing;
using System.Drawing;

namespace test
{
    class Program
    {
        static void Main(string[] args)
        {

            Presentation presentation = new Presentation();

            IAutoShape shape1 = presentation.Slides[0].Shapes.AppendShape(ShapeType.RoundCornerRectangle, new RectangleF(150, 150, 150, 150));
            shape1.Fill.FillType = FillFormatType.Solid;
            shape1.Fill.SolidColor.KnownColor = KnownColors.RoyalBlue;
            ShapeThreeD Demo1 = shape1.ThreeD.ShapeThreeD;
            Demo1.PresetMaterial = PresetMaterialType.Powder;
            Demo1.TopBevel.PresetType = BevelPresetType.ArtDeco;
            Demo1.TopBevel.Height = 4;
            Demo1.TopBevel.Width = 12;
            Demo1.BevelColorMode = BevelColorType.Contour;
            Demo1.ContourColor.KnownColor = KnownColors.LightBlue;
            Demo1.ContourWidth = 3.5;

            IAutoShape shape2 = presentation.Slides[0].Shapes.AppendShape(ShapeType.Pentagon, new RectangleF(400, 150, 150, 150));
            shape2.Fill.FillType = FillFormatType.Solid;
            shape2.Fill.SolidColor.KnownColor = KnownColors.LawnGreen;
            ShapeThreeD Demo2 = shape2.ThreeD.ShapeThreeD;
            Demo2.PresetMaterial = PresetMaterialType.SoftEdge;
            Demo2.TopBevel.PresetType = BevelPresetType.SoftRound;
            Demo2.TopBevel.Height = 12;
            Demo2.TopBevel.Width = 12;
            Demo2.BevelColorMode = BevelColorType.Contour;
            Demo2.ContourColor.KnownColor = KnownColors.LawnGreen;
            Demo2.ContourWidth = 5;

            presentation.SaveToFile("result.pptx", FileFormat.Pptx2010);
            System.Diagnostics.Process.Start("result.pptx");
        }
    }
}
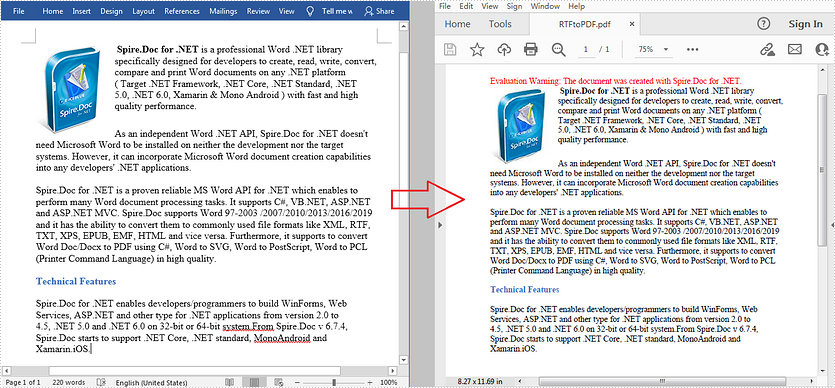
C#/VB.NET: Convert RTF to PDF
RTF (Rich Text Format) is a cross-platform document developed by Microsoft in the 1980s. RTF can be opened by most word processors, and it is also convenient for editing. But when it comes to sharing and printing documents in daily work, it’s more recommended to convert the RTF to PDF for further processing. In this article, you will learn how to convert RTF to PDF programmatically using Spire.Doc for .NET.
Install Spire.Doc for .NET
To begin with, you need to add the DLL files included in the Spire.Doc for .NET package as references in your .NET project. The DLL files can be either downloaded from this link or installed via NuGet.
PM> Install-Package Spire.Doc
Convert RTF to PDF in C# and VB.NET
Spire.Doc for .NET enables you to directly load a file with .rtf extension and then convert it to PDF with only three lines of code. The detailed steps are as follows.
- Create a Document instance.
- Load a sample RTF document using Document.LoadFromFile() method.
- Save the document as a PDF file using Document.SaveToFile() method.
- C#
- VB.NET
using Spire.Doc;

namespace RTFtoPDF
{
    class Program
    {
        static void Main(string[] args)
        {
            //Create a Document instance
            Document doc = new Document();

            //Load a sample RTF document
            doc.LoadFromFile("sample.rtf", FileFormat.Rtf);

            //Save it to PDF
            doc.SaveToFile("RTFtoPDF.pdf", FileFormat.PDF);
        }
    }
}
Apply for a Temporary License
If you'd like to remove the evaluation message from the generated documents, or to get rid of the function limitations, please request a 30-day trial license for yourself.
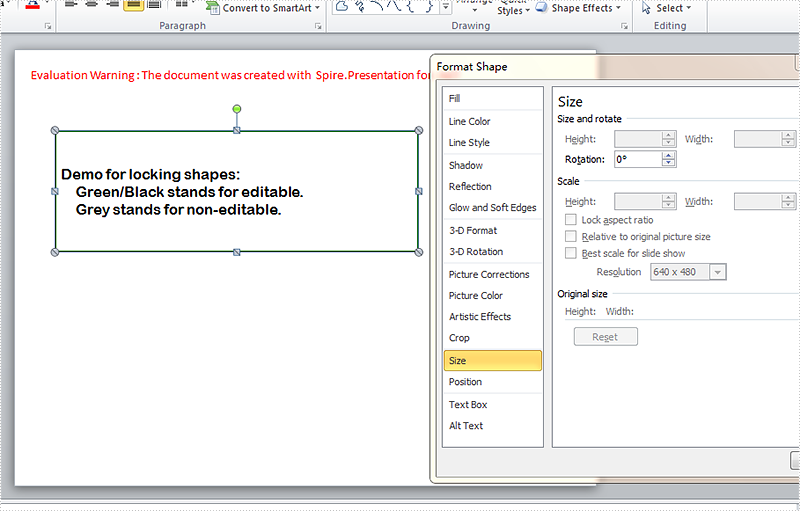
How to prevent or allow changes to shapes
After finishing designs of shapes in slides, accidental changes might happen if we haven't made necessary protecting settings. Locking shapes from being selected firstly or preventing changes to shape attributes (like size, position, rotation etc.) can be used to prevent changes to shapes. It's necessary to mention that Spire.Presentation supports the features to prevent changes to shapes. This article is going to introduce how to prevent or allow changes to shapes in C# using Spire.Presentation.
Note: before start, please download the latest version of Spire.Presentation and add the .dll in the bin folder as the reference of Visual Studio.
Step 1: create a presentation file and add a sample shape.
Presentation presentation = new Presentation();
            IAutoShape shape = presentation.Slides[0].Shapes.AppendShape(ShapeType.Rectangle, new RectangleF(50, 100, 450, 150));
Step 2: format the sample shape.
            shape.Fill.FillType = FillFormatType.None;
            shape.ShapeStyle.LineColor.Color = Color.DarkGreen;
            shape.TextFrame.Paragraphs[0].Alignment = TextAlignmentType.Justify;
            shape.TextFrame.Text = "Demo for locking shapes:\n    Green/Black stands for editable.\n    Grey points stands for non-editable.";
            shape.TextFrame.Paragraphs[0].TextRanges[0].LatinFont = new TextFont("Arial Rounded MT Bold");
            shape.TextFrame.Paragraphs[0].TextRanges[0].Fill.FillType = FillFormatType.Solid;
            shape.TextFrame.Paragraphs[0].TextRanges[0].Fill.SolidColor.Color = Color.Black;
Step 3: set which operations are disabled on the shape to prevent changes. Here the selection and rotation changing of the shape are allowed while the changes of size, position, shape type, text, rotation, handles, and aspect ratio are not allowed.
            shape.Locking.RotationProtection = false;
            shape.Locking.SelectionProtection = false;
            shape.Locking.ResizeProtection = true;
            shape.Locking.PositionProtection = true;
            shape.Locking.ShapeTypeProtection = true;
            shape.Locking.AspectRatioProtection = true;
            shape.Locking.TextEditingProtection = true;
            shape.Locking.AdjustHandlesProtection = true;
Step 4: save the document and launch to see effects.
            presentation.SaveToFile("result.pptx", FileFormat.Pptx2010);
            System.Diagnostics.Process.Start("result.pptx");
Effects:
Full codes:
using System;
using System.Collections.Generic;
using System.Linq;
using System.Text;
using Spire.Presentation;
using Spire.Presentation.Drawing;
using System.Drawing;

namespace test
{
    class Program
    {
        static void Main(string[] args)
        {

            Presentation presentation = new Presentation();
            IAutoShape shape = presentation.Slides[0].Shapes.AppendShape(ShapeType.Rectangle, new RectangleF(50, 100, 450, 150));

            shape.Fill.FillType = FillFormatType.None;
            shape.ShapeStyle.LineColor.Color = Color.DarkGreen;
            shape.TextFrame.Paragraphs[0].Alignment = TextAlignmentType.Justify;
            shape.TextFrame.Text = "Demo for locking shapes:\n    Green/Black stands for editable.\n    Grey stands for non-editable.";
            shape.TextFrame.Paragraphs[0].TextRanges[0].LatinFont = new TextFont("Arial Rounded MT Bold");
            shape.TextFrame.Paragraphs[0].TextRanges[0].Fill.FillType = FillFormatType.Solid;
            shape.TextFrame.Paragraphs[0].TextRanges[0].Fill.SolidColor.Color = Color.Black;

            shape.Locking.RotationProtection = false;
            shape.Locking.SelectionProtection = false;
            shape.Locking.ResizeProtection = true;
            shape.Locking.PositionProtection = true;
            shape.Locking.ShapeTypeProtection = true;
            shape.Locking.AspectRatioProtection = true;
            shape.Locking.TextEditingProtection = true;
            shape.Locking.AdjustHandlesProtection = true;

            presentation.SaveToFile("result.pptx", FileFormat.Pptx2010);
            System.Diagnostics.Process.Start("result.pptx");
        }
    }
}
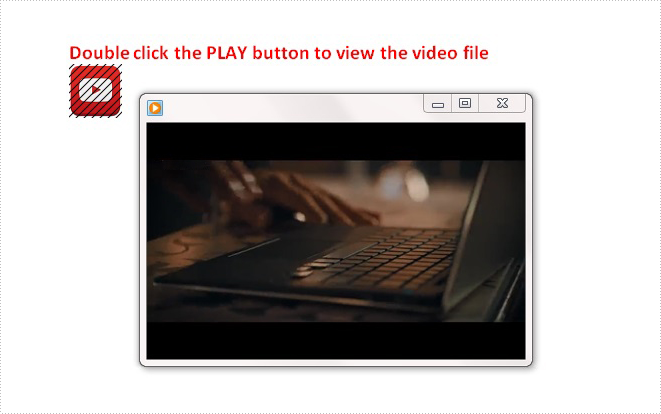
How to Embed Media File in Word in C#, VB.NET
Spire.Doc supports to insert any type of file such as Excel, PDF, PowerPoint and etc, as OLE object into a Word document. In this article, you'll learn how to add a media file (audio or video) to a Word document using Spire.Doc in C#, VB.NET.
In the class of DocOleObject, a method named AppendOleObject(Stream oleStream, DocPicture olePicture, string fileExtension) is available for users to insert media file with the extension of mp3, mp4, avi or any other format into a Word document. The three parameters in this method represent:
- oleStream: The OLE file stream.
- olePicture: The image (icon) that is displayed in Word to show the OLE object.
- fileExtension: The file extension.
Code Snippet:
Step 1: Initialize a new instance of Document class and add a new section.
Document doc = new Document();
Section section = doc.AddSection();
Step 2: Add a new paragraph, append some formatted text into the paragraph.
Paragraph para1 = section.AddParagraph();
para1.AppendText("Double click the PLAY button to view the video file");
ParagraphStyle style1 = new ParagraphStyle(doc);
style1.Name = "Style";
style1.CharacterFormat.FontName = "Calibri";
style1.CharacterFormat.FontSize = 15;
style1.CharacterFormat.Bold = true;
style1.CharacterFormat.TextColor = Color.Red;
doc.Styles.Add(style1);
para1.ApplyStyle(style1.Name);
Step 3: Add another paragraph, append a video file as OLE object into the paragraph.
Paragraph para2 = section.AddParagraph();
Stream s = File.OpenRead("media.mp4");
DocPicture pic = new DocPicture(doc);
pic.LoadImage(Image.FromFile("button.png"));
para2.AppendOleObject(s, pic, "mp4");
Step 4: Save the view the file.
doc.SaveToFile("Result.docx", FileFormat.Docx2010);
System.Diagnostics.Process.Start("Result.docx");
Output:
Full Code:
using Spire.Doc;
using Spire.Doc.Documents;
using Spire.Doc.Fields;
using System.Drawing;
using System.IO;
namespace EmbedMediaFile
{
    class Program
    {

        static void Main(string[] args)
        {
            //create a new Word document and insert section
            Document doc = new Document();
            Section section = doc.AddSection();
            //add a paragraph and append some text
            Paragraph para1 = section.AddParagraph();
            para1.AppendText("Double click the PLAY button to view the video file");
            ParagraphStyle style1 = new ParagraphStyle(doc);
            style1.Name = "Style";
            style1.CharacterFormat.FontName = "Calibri";
            style1.CharacterFormat.FontSize = 15;
            style1.CharacterFormat.Bold = true;
            style1.CharacterFormat.TextColor = Color.Red;
            doc.Styles.Add(style1);
            para1.ApplyStyle(style1.Name);
            //add another paragraph, append video file as OLE object in Word
            Paragraph para2 = section.AddParagraph();
            Stream s = File.OpenRead("media.mp4");
            DocPicture pic = new DocPicture(doc);
            pic.LoadImage(Image.FromFile("button.png"));
            para2.AppendOleObject(s, pic, "mp4");
            //save and view the file
            doc.SaveToFile("Result.docx", FileFormat.Docx2010);
            System.Diagnostics.Process.Start("Result.docx");

        }
    }
}
Imports Spire.Doc
Imports Spire.Doc.Documents
Imports Spire.Doc.Fields
Imports System.Drawing
Imports System.IO
Namespace EmbedMediaFile
	Class Program

		Private Shared Sub Main(args As String())
			'create a new Word document and insert section
			Dim doc As New Document()
			Dim section As Section = doc.AddSection()
			'add a paragraph and append some text
			Dim para1 As Paragraph = section.AddParagraph()
			para1.AppendText("Double click the PLAY button to view the video file")
			Dim style1 As New ParagraphStyle(doc)
			style1.Name = "Style"
			style1.CharacterFormat.FontName = "Calibri"
			style1.CharacterFormat.FontSize = 15
			style1.CharacterFormat.Bold = True
			style1.CharacterFormat.TextColor = Color.Red
			doc.Styles.Add(style1)
			para1.ApplyStyle(style1.Name)
			'add another paragraph, append video file as OLE object in Word
			Dim para2 As Paragraph = section.AddParagraph()
			Dim s As Stream = File.OpenRead("media.mp4")
			Dim pic As New DocPicture(doc)
			pic.LoadImage(Image.FromFile("button.png"))
			para2.AppendOleObject(s, pic, "mp4")
			'save and view the file
			doc.SaveToFile("Result.docx", FileFormat.Docx2010)
			System.Diagnostics.Process.Start("Result.docx")

		End Sub
	End Class
End Namespace