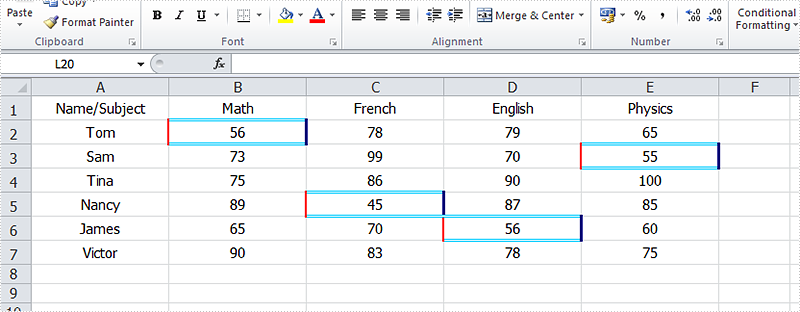
Using conditional formatting in Excel, we could highlight interesting cells, emphasize unusual values and visualize data with Data Bars, Color Scales and Icon Sets based on criteria. In the two articles Alternate Row Colors in Excel with Conditional Formatting and Apply Conditional Formatting to a Data Range, we have introduce the method to set fill, font, data bars, color scales and icon sets in conditional formatting using Spire.XLS. This article is going to introduce the method to format cells with borders in conditional formatting.
Note: before start, please download the latest version of Spire.XLS and add the .dll in the bin folder as the reference of Visual Studio.
Step 1: Create a new workbook and add sample data.
            Workbook workbook = new Workbook();
            Worksheet sheet = workbook.Worksheets[0];

            sheet.Range["A1"].Value = "Name/Subject";
            sheet.Range["A2"].Value = "Tom";
            sheet.Range["A3"].Value = "Sam";
            sheet.Range["A4"].Value = "Tina";
            sheet.Range["A5"].Value = "Nancy";
            sheet.Range["A6"].Value = "James";
            sheet.Range["A7"].Value = "Victor";
            sheet.Range["B1"].Value = "Math";
            sheet.Range["C1"].Value = "French";
            sheet.Range["D1"].Value = "English";
            sheet.Range["E1"].Value = "Physics";
            sheet.Range["B2"].NumberValue = 56;
            sheet.Range["B3"].NumberValue = 73;
            sheet.Range["B4"].NumberValue = 75;
            sheet.Range["B5"].NumberValue = 89;
            sheet.Range["B6"].NumberValue = 65;
            sheet.Range["B7"].NumberValue = 90;
            sheet.Range["C2"].NumberValue = 78;
            sheet.Range["C3"].NumberValue = 99;
            sheet.Range["C4"].NumberValue = 86;
            sheet.Range["C5"].NumberValue = 45;
            sheet.Range["C6"].NumberValue = 70;
            sheet.Range["C7"].NumberValue = 83;
            sheet.Range["D2"].NumberValue = 79;
            sheet.Range["D3"].NumberValue = 70;
            sheet.Range["D4"].NumberValue = 90;
            sheet.Range["D5"].NumberValue = 87;
            sheet.Range["D6"].NumberValue = 56;
            sheet.Range["D7"].NumberValue = 78;
            sheet.Range["E2"].NumberValue = 65;
            sheet.Range["E3"].NumberValue = 55;
            sheet.Range["E4"].NumberValue = 100;
            sheet.Range["E5"].NumberValue = 85;
            sheet.Range["E6"].NumberValue = 60;
            sheet.Range["E7"].NumberValue = 75;

            sheet.AllocatedRange.RowHeight = 17;
            sheet.AllocatedRange.ColumnWidth = 17;
            sheet.AllocatedRange.VerticalAlignment = VerticalAlignType.Center;
            sheet.AllocatedRange.HorizontalAlignment = HorizontalAlignType.Center;
Step 2: Set the formatting rule using formula. Here the rule is the number values less than 60.
            ConditionalFormatWrapper format1 = sheet.Range["B2:E7"].ConditionalFormats.AddCondition();
            format1.FirstFormula = "60";
            format1.Operator = ComparisonOperatorType.Less;
Step 3: Set border colors and styles for cells that match the condition.
            format1.LeftBorderColor = Color.Red;
            format1.RightBorderColor = Color.DarkBlue;
            format1.TopBorderColor = Color.DeepSkyBlue;
            format1.BottomBorderColor = Color.DeepSkyBlue;

            format1.LeftBorderStyle = LineStyleType.Medium;
            format1.RightBorderStyle = LineStyleType.Thick;
            format1.TopBorderStyle = LineStyleType.Double;
            format1.BottomBorderStyle = LineStyleType.Double;
Step 4: Save the document and launch to see effects.
            workbook.SaveToFile("sample.xlsx", ExcelVersion.Version2010);
            System.Diagnostics.Process.Start("sample.xlsx");
Effects:

Full Codes:
using System;
using System.Collections.Generic;
using System.Linq;
using System.Text;
using Spire.Xls;
using System.Drawing;

namespace Test
{
    class Program
    {
        static void Main(string[] args)
        {
            Workbook workbook = new Workbook();
            Worksheet sheet = workbook.Worksheets[0];

            sheet.Range["A1"].Value = "Name/Subject";
            sheet.Range["A2"].Value = "Tom";
            sheet.Range["A3"].Value = "Sam";
            sheet.Range["A4"].Value = "Tina";
            sheet.Range["A5"].Value = "Nancy";
            sheet.Range["A6"].Value = "James";
            sheet.Range["A7"].Value = "Victor";
            sheet.Range["B1"].Value = "Math";
            sheet.Range["C1"].Value = "French";
            sheet.Range["D1"].Value = "English";
            sheet.Range["E1"].Value = "Physics";
            sheet.Range["B2"].NumberValue = 56;
            sheet.Range["B3"].NumberValue = 73;
            sheet.Range["B4"].NumberValue = 75;
            sheet.Range["B5"].NumberValue = 89;
            sheet.Range["B6"].NumberValue = 65;
            sheet.Range["B7"].NumberValue = 90;
            sheet.Range["C2"].NumberValue = 78;
            sheet.Range["C3"].NumberValue = 99;
            sheet.Range["C4"].NumberValue = 86;
            sheet.Range["C5"].NumberValue = 45;
            sheet.Range["C6"].NumberValue = 70;
            sheet.Range["C7"].NumberValue = 83;
            sheet.Range["D2"].NumberValue = 79;
            sheet.Range["D3"].NumberValue = 70;
            sheet.Range["D4"].NumberValue = 90;
            sheet.Range["D5"].NumberValue = 87;
            sheet.Range["D6"].NumberValue = 56;
            sheet.Range["D7"].NumberValue = 78;
            sheet.Range["E2"].NumberValue = 65;
            sheet.Range["E3"].NumberValue = 55;
            sheet.Range["E4"].NumberValue = 100;
            sheet.Range["E5"].NumberValue = 85;
            sheet.Range["E6"].NumberValue = 60;
            sheet.Range["E7"].NumberValue = 75;

            sheet.AllocatedRange.RowHeight = 17;
            sheet.AllocatedRange.ColumnWidth = 17;
            sheet.AllocatedRange.VerticalAlignment = VerticalAlignType.Center;
            sheet.AllocatedRange.HorizontalAlignment = HorizontalAlignType.Center;

            ConditionalFormatWrapper format1 = sheet.Range["B2:E7"].ConditionalFormats.AddCondition();
            format1.FirstFormula = "60";
            format1.Operator = ComparisonOperatorType.Less;

            format1.LeftBorderColor = Color.Red;
            format1.RightBorderColor = Color.DarkBlue;
            format1.TopBorderColor = Color.DeepSkyBlue;
            format1.BottomBorderColor = Color.DeepSkyBlue;

            format1.LeftBorderStyle = LineStyleType.Medium;
            format1.RightBorderStyle = LineStyleType.Thick;
            format1.TopBorderStyle = LineStyleType.Double;
            format1.BottomBorderStyle = LineStyleType.Double;

            workbook.SaveToFile("sample.xlsx", ExcelVersion.Version2010);
            System.Diagnostics.Process.Start("sample.xlsx");

        }
    }
}


