Python (318)
Introduction
Digital signatures help verify the authenticity and integrity of PDF documents. However, if a signing certificate expires or is revoked, the signature alone may no longer be considered valid. To solve this, a timestamp can be added to the digital signature, proving that the document was signed at a specific point in time-validated by a trusted Time Stamp Authority (TSA).
In this tutorial, we will introduce how to use the Spire.PDF for Python library to digitally sign a PDF document with a timestamp in Python.
Prerequisites
To follow this tutorial, ensure you have the following:
- Spire.PDF for Python library
- A valid digital certificate (.pfx file)
- A sample PDF file
- An image to display as the signature appearance (optional)
- A reliable Time Stamp Authority (TSA) URL
pip install Spire.PDF
How to Digitally Sign a PDF with a Timestamp in Python
In Spire.PDF for Python, the Security_PdfSignature class is used to create a digital signature, and the ConfigureTimestamp(tsaUrl) method in this class is used to embed a timestamp into the signature. The tsaUrl parameter specifies the address of the TSA server.
Steps to Add a Timestamped Digital Signature
Follow these steps to add a timestamped digital signature to a PDF in Python using Spire.PDF for Python:
- Create a PdfDocument instance and use the LoadFromFile() method to load the PDF you want to sign.
- Create a Security_PdfSignature object, specifying the target page, certificate file path, certificate password, and signature name.
- Configure the signature's appearance, including its position, size, display labels, and signature image.
- Embed a timestamp by calling the ConfigureTimestamp(tsaUrl) method with a valid Time Stamp Authority (TSA) URL.
- Save the signed PDF using the SaveToFile() method.
Code Example
- Python
from spire.pdf import *

inputFile = "Sample.pdf"
inputFile_pfx = "gary.pfx"
inputImage = "E-iceblueLogo.png"
outputFile = "SignWithTimestamp.pdf"

# Create a PdfDocument instance and load the PDF file to be signed
doc = PdfDocument()
doc.LoadFromFile(inputFile)

# Create a digital signature object by specifying the document, target page, certificate file path, certificate password, and signature name
signature = Security_PdfSignature(doc, doc.Pages.get_Item(0), inputFile_pfx, "e-iceblue", "signature")

# Define the position and size of the signature on the page (unit: point)
signature.Bounds = RectangleF(PointF(90.0, 600.0), SizeF(180.0, 90.0))

# Set the labels and content for the signature details
signature.NameLabel = "Digitally signed by: "
signature.Name = "Gary"
signature.LocationInfoLabel = "Location: "
signature.LocationInfo = "CN"
signature.ReasonLabel = "Reason: "
signature.Reason = "Ensure authenticity"
signature.ContactInfoLabel = "Contact Number: "
signature.ContactInfo = "028-81705109"

# Set document permissions: allow form filling, forbid further changes
signature.DocumentPermissions = PdfCertificationFlags.AllowFormFill.value | PdfCertificationFlags.ForbidChanges.value

# Set the graphic mode to include both image and signature details,
# and set the signature image
signature.GraphicsMode = Security_GraphicMode.SignImageAndSignDetail
signature.SignImageSource = PdfImage.FromFile(inputImage)

# Embed a timestamp into the signature using a Time Stamp Authority (TSA) server
url = "http://tsa.cesnet.cz:3161/tsa"
signature.ConfigureTimestamp(url)

# Save the signed PDF and close the document
doc.SaveToFile(outputFile)
doc.Close()
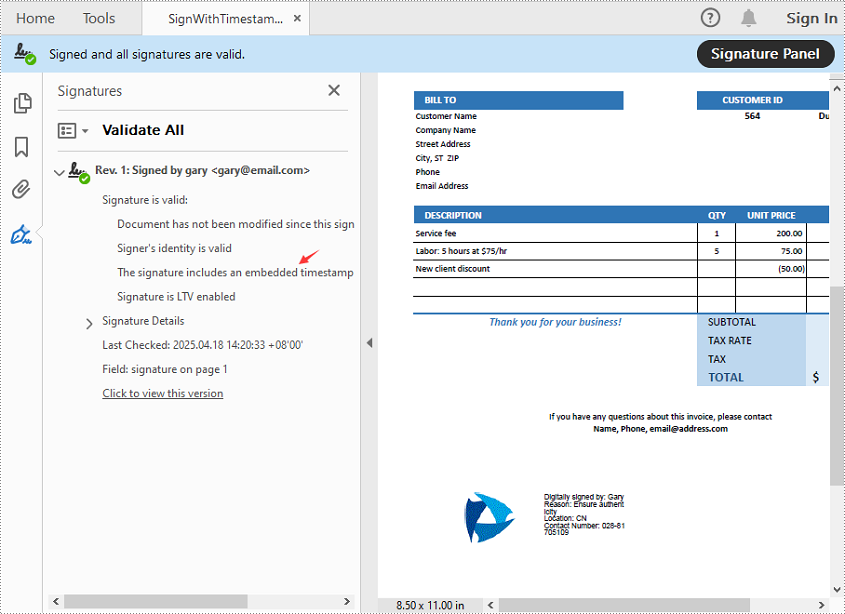
View the Timestamp in PDF
When you open the signed PDF in a viewer like Adobe Acrobat, you can click the Signature Panel to view both the digital signature and the timestamp, which confirm the document’s validity and the signing time:
Get a Free License
To fully experience the capabilities of Spire.PDF for Python without any evaluation limitations, you can request a free 30-day trial license.
Conclusion
Timestamping enhances the reliability of digital signatures by proving when a PDF was signed-even after the certificate has expired. With Spire.PDF for Python, implementing a timestamped digital signature is a straightforward process. Whether you're handling contracts, invoices, or confidential records, this approach ensures long-term document validity and compliance.
PostScript, developed by Adobe, is a page description language known for its high-quality graphics and text rendering capabilities. By converting PDF to PostScript, you can have a precise control over complex graphics, fonts and colors when printing brochures, magazines, advertisements, or other materials.
PCL, on the other hand, is a printer control language developed by Hewlett-Packard. It is designed to be efficient and easy for the printers to interpret. Converting PDF to PCL ensures compatibility with a large number of printers and also optimizes the printing speed for text-heavy documents such as academic reports, letters, or contracts.
This article will demonstrate how to convert PDF to PS or PDF to PCL in Python using Spire.PDF for Python.
Install Spire.PDF for Python
This scenario requires Spire.PDF for Python. It can be easily installed in your Windows through the following pip command.
pip install Spire.PDF
If you are unsure how to install, please refer to this tutorial: How to Install Spire.PDF for Python on Windows
Convert PDF to PostScript in Python
Converting PDF to PS can improve the quality of the printed output. Spire.PDF for .NET allows you to load a PDF file and then converting it to PS format using PdfDocument.SaveToFile(filename: string, FileFormat.POSTSCRIPT) method. The following are the detailed steps.
- Create a PdfDocument instance.
- Load a PDF file using PdfDocument.LoadFromFile() method.
- Save the PDF file to PostScript format using PdfDocument.SaveToFile(filename: string, FileFormat.POSTSCRIPT) method.
- Python
from spire.pdf.common import *
from spire.pdf import *

# Specify the input and output file paths
inputFile = "input1.pdf"
outputFile = "PdfToPostScript.ps"

# Create a PdfDocument instance
pdf = PdfDocument()

# Load a PDF document
pdf.LoadFromFile(inputFile)

# Convert the PDF to a PostScript file
pdf.SaveToFile(outputFile, FileFormat.POSTSCRIPT)
pdf.Close()

Convert PDF to PCL in Python
Converting PDF to PCL can ensure faster printing speed. By using the PdfDocument.SaveToFile(filename: string, FileFormat.PCL) method, you can save a loaded PDF file as a PCL file. The following are the detailed steps.
- Create a PdfDocument instance.
- Load a PDF file using PdfDocument.LoadFromFile() method.
- Save the PDF file to PCL format using PdfDocument.SaveToFile(filename: string, FileFormat.PCL) method.
- Python
from spire.pdf.common import *
from spire.pdf import *

# Specify the input and output file paths
inputFile = "input1.pdf"
outputFile = "ToPCL\\PdfToPcl.pcl"

# Create a PdfDocument instance
pdf = PdfDocument()

# Load a PDF document
pdf.LoadFromFile(inputFile)

# Convert the PDF to a PCL file
pdf.SaveToFile(outputFile, FileFormat.PCL)
pdf.Close()

Get a Free License
To fully experience the capabilities of Spire.PDF for Python without any evaluation limitations, you can request a free 30-day trial license.
In Microsoft Excel, each worksheet acts as a unique space for organizing distinct sets of data, projects, or analyses. Efficient management of these worksheets is crucial for quick navigation and effective data handling. By renaming worksheets, users can create intuitive labels that clearly indicate the content of each sheet, making it easier to locate specific information. Furthermore, customizing tab colors enhances visual organization, allowing users to differentiate between various sections or categories at a glance.
In this article, we will demonstrate how to change worksheet names and set tab colors in Excel using Python and the Spire.XLS for Python library.
Install Spire.XLS for Python
This scenario requires Spire.XLS for Python and plum-dispatch v1.7.4. They can be easily installed in your Windows through the following pip command.
pip install Spire.XLS
If you are unsure how to install, please refer to this tutorial: How to Install Spire.XLS for Python on Windows
Change Worksheet Names in Excel in Python
Spire.XLS for Python provides the Worksheet.Name property to rename a worksheet in an Excel file. The detailed steps are as follows.
- Create an object of the Workbook class.
- Load a sample Excel file using the Workbook.LoadFromFile() method.
- Get the desired worksheet using the Worbook.Worksheets[] property.
- Rename the worksheet using the Worksheet.Name property.
- Save the result file using the Workbook.SaveToFile() method.
- Python
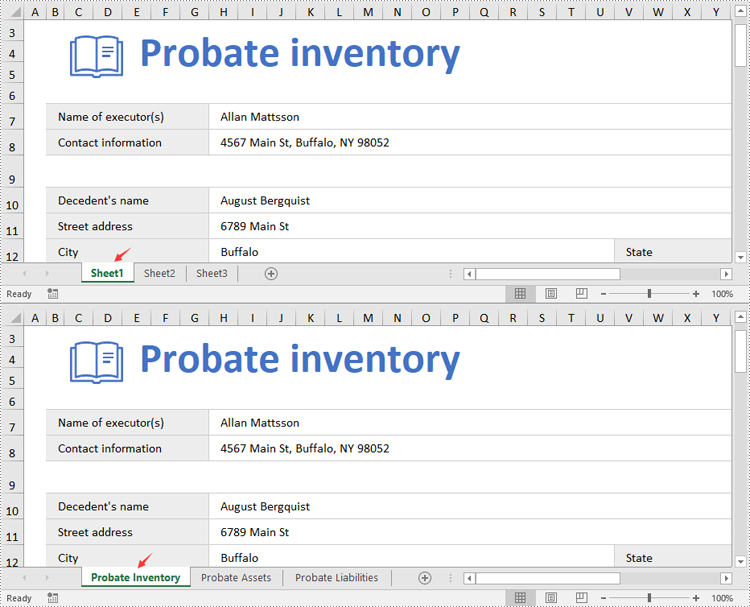
from spire.xls import *
from spire.xls.common import *

# Specify the input and output file paths
inputFile = "Sample1.xlsx"
outputFile = "RenameWorksheets.xlsx"

# Create an object of the Workbook class
workbook = Workbook()
# Load a sample Excel file
workbook.LoadFromFile(inputFile)

# Rename the first worksheet
sheet = workbook.Worksheets[0]
sheet.Name = "Probate Inventory"

# Rename the second worksheet
sheet = workbook.Worksheets[1]
sheet.Name = "Probate Assets"

# Rename the third worksheet
sheet = workbook.Worksheets[2]
sheet.Name = "Probate Liabilities"

# Save the result file
workbook.SaveToFile(outputFile, ExcelVersion.Version2013)
workbook.Dispose()
Set Worksheet Tab Colors in Excel in Python
The Worksheet.TabColor property allows setting a tab color for a worksheet in an Excel file. The detailed steps are as follows.
- Create an object of the Workbook class.
- Load a sample Excel file using the Workbook.LoadFromFile() method.
- Get the desired worksheet using the Worbook.Worksheets[] property.
- Rename the worksheet using the Worksheet.TabColor property.
- Save the result file using the Workbook.SaveToFile() method.
- Python
from spire.xls import *
from spire.xls.common import *

# Specify the input and output file paths
inputFile = "Sample2.xlsx"
outputFile = "SetTabColor.xlsx"

# Create an object of the Workbook class
workbook = Workbook()
# Load a sample Excel file
workbook.LoadFromFile(inputFile)

# Set the tab color for the first worksheet
worksheet = workbook.Worksheets[0]
worksheet.TabColor = Color.get_Red()

# Set the tab color for the second worksheet
worksheet = workbook.Worksheets[1]
worksheet.TabColor = Color.get_Green()

# Set the tab color for the third worksheet
worksheet = workbook.Worksheets[2]
worksheet.TabColor = Color.get_LightBlue()

# Save the result file
workbook.SaveToFile(outputFile, ExcelVersion.Version2013)
workbook.Dispose()

Get a Free License
To fully experience the capabilities of Spire.XLS for Python without any evaluation limitations, you can request a free 30-day trial license.
Worksheet names can be used as unique identifiers for different collections of data in a workbook. When working with large Excel files that contain multiple worksheets, knowing the name of each worksheet can help you quickly identify where specific types of information are stored. In this article, you will learn how to get worksheet names in Excel in Python using Spire.XLS for Python.
Install Spire.XLS for Python
This scenario requires Spire.XLS for Python and plum-dispatch v1.7.4. They can be easily installed in your Windows through the following pip command.
pip install Spire.XLS
If you are unsure how to install, please refer to this tutorial: How to Install Spire.XLS for Python on Windows
Get All Worksheet Names in Excel in Python
The Worksheet.Name property returns the name of a Worksheet. To retrieve the names of all the worksheets in Excel (including hidden ones), you can iterate through each worksheet and get their names with this property. The following are the detailed steps:
- Create a Workbook instance.
- Load an Excel file using Workbook.LoadFromFile() method.
- Create a list to store the retrieved worksheet names.
- Iterate through each worksheet.
- Get the name of each worksheet through Worksheet.Name property and append it to the list.
- Write the contents of the list to a text file.
- Python
from spire.xls import *
from spire.xls.common import *

# Specifiy the input and output file paths
inputFile = "BudgetSum.xlsx"
outputFile = "GetWorksheetNames.txt"

# Create a Workbook instance
workbook = Workbook()

# Load an Excel file
workbook.LoadFromFile(inputFile)

# Create a list to store the worksheet names
names = []

# Iterate through each worksheet
for sheet in workbook.Worksheets:

    # Get each worksheet name and add it to the list
    names.append(sheet.Name)

# Write to a txt file
with open(outputFile, "w", encoding="utf-8") as file:
    file.write("\n".join(names))

Get Hidden Worksheet Names in Excel in Python
If you only need to retrieve the names of the hidden worksheets, you can first iterate through each worksheet to determine whether a worksheet is hidden, and if so, get its name through the Worksheet.Name property. The following are the detailed steps:
- Create a Workbook instance.
- Load an Excel file using Workbook.LoadFromFile() method.
- Create a list to store the retrieved worksheet names.
- Iterate through each worksheet and find the hidden worksheets.
- Get the names of the hidden worksheets through Worksheet.Name property and append them to the list.
- Write the contents of the list to a text file.
- Python
from spire.xls import *
from spire.xls.common import *

# Specifiy the input and output file paths
inputFile = "BudgetSum.xlsx"
outputFile = "GetHiddenWorksheetNames.txt"

# Create a Workbook instance
workbook = Workbook()

# Load an Excel file
workbook.LoadFromFile(inputFile)

# Create a list to store the worksheet names
names = []

# Iterate through each worksheet
for sheet in workbook.Worksheets:

    # Detect the hidden worksheet
    if sheet.Visibility == WorksheetVisibility.Hidden:

        # Get the hidden worksheet name and add it to the list
        names.append(sheet.Name)

# Write to a txt file
with open(outputFile, "w", encoding="utf-8") as file:
    file.write("\n".join(names))

Get a Free License
To fully experience the capabilities of Spire.XLS for Python without any evaluation limitations, you can request a free 30-day trial license.
In today's data-driven world, efficiently transferring data into Excel is essential. Python's versatile ecosystem automates the process, eliminating manual entry, reducing errors, and handling large datasets beyond Excel's limits. Whether pulling data from APIs, databases, or unstructured sources, Python creates dynamic workflows that ensure consistency and scalability. Its compatibility with various data formats transforms raw data into structured Excel files, bridging complex data pipelines with user-friendly outputs while boosting productivity and enabling professionals to focus on high-value analysis. This article will demonstrate how to use Spire.XLS for Python to import data into Excel workbooks within Python applications.
- How to Write Data into Excel Files with Spire.XLS for Python
- Import CSV Data into Excel Worksheets
- Transfer Data and Worksheets Between Excel Files
- Import JSON Data into Excel Worksheets
- Import XML Data into Excel Worksheets
- Import Database Records into Excel Worksheets
- Import HTML Table Data into Excel Worksheets
Install Spire.XLS for Python
This scenario requires Spire.XLS for Python and plum-dispatch v1.7.4. They can be easily installed in your Windows through the following pip command.
pip install Spire.XLS
If you are unsure how to install, please refer to: How to Install Spire.XLS for Python on Windows
How to Write Data into Excel Files with Spire.XLS for Python
Spire.XLS for Python is an Excel file processing library that supports reading, editing, and writing Excel files. With this library, you can effortlessly write data into Excel worksheets, apply formatting, and save the workbook as a file.
Before writing data into Excel worksheets, Python provides a variety of built-in and third-party libraries-such as json, xml.etree.ElementTree, and BeautifulSoup-that allow you to read and process data from different file formats, including TXT, CSV, JSON, XML, and HTML. These libraries help transform raw or semi-structured data into lists, dictionaries, or dataframes that are easy to work with in Python.
Once the data is extracted and structured, Spire.XLS for Python can be used to write it into Excel workbooks. The library offers precise control over worksheet creation, cell-level data entry, formatting, and file export in Excel-compatible formats.
Steps to Write Data into Excel Using Spire.XLS for Python:
- Initialize a Workbook
Create an instance of the Workbook class to generate a new Excel workbook with three default worksheets, or use the Workbook.LoadFromFile(filePath: str) method to load an existing Excel file. - Create or Clear Worksheets
Use the Workbook.Worksheets.get_Item() method to get worksheets, or the Workbook.Worksheets.Add(sheetName: str) method to add worksheets. - Prepare the Data
Use Python libraries such as json, csv, or xml.etree.ElementTree to extract and organize your data into row and column structures. - Write Headers and Data
Iterate through your data and use the Worksheet.Range.get_Item(row: int, col: int).Value property to assign values to specific cells. - Format the Worksheet (Optional)
Apply styles using the CellRange.ApplyStyle() method, autofit columns using the Worksheet.AutoFitColumn() method, and set borders or colors to improve the appearance and readability of the worksheet. - Save the Workbook
Save the final Excel file using the Workbook.SaveToFile(filePath: str, format: FileFormat) method in your preferred Excel version.
Import CSV Data into Excel Worksheets
Importing data from CSV files into Excel is a fundamental task in data preparation. With Spire.XLS for Python, you can easily load structured data from CSV files using the Workbook.LoadFromFile(filePath: str, separator: str) method of the Workbook class and convert it into a well-formatted Excel workbook. In fact, data from text files can be imported in the same way. This method supports custom cell styling, header addition, and ensures the data is clean and ready for analysis or reporting.
Steps to import CSV data into Excel workbooks:
- Create an instance of the Workbook class.
- Load the CSV table data using the Workbook.LoadFromFile(filePath: str, separator: str) method and specify the file path and the column separator (e.g., comma or tab).
- Access the first worksheet using the Workbook.Worksheets.get_Item(index: int) method.
- Optionally, read the table from the first worksheet and write it into another using the Worksheet.Range.get_Item(row: int, col: int).Value property of the Worksheet class.
- Format the worksheet as needed and save the result using the Workbook.SaveToFile(filePath: str, fileFormat) method.
- Python
from spire.xls import Workbook, FileFormat, BuiltInStyles

# Create a Workbook object
workbook = Workbook()

# Load the table from the CSV or text file
workbook.LoadFromFile("Sample.csv", ",")
# workbook.LoadFromFile("Sample.txt", "\t")

# Get the first worksheet
sheet = workbook.Worksheets.get_Item(0)
# Format the table
sheet.Rows.get_Item(0).BuiltInStyle = BuiltInStyles.Heading4
for i in range(1, sheet.Rows.Count):
    sheet.Rows.get_Item(i).BuiltInStyle = BuiltInStyles.Accent4_20
for j in range(sheet.Columns.Count):
    sheet.AutoFitColumn(j + 1)

# Save the workbook
workbook.SaveToFile("output/TextCSVToExcel.xlsx", FileFormat.Version2016)
workbook.Dispose()

Transfer Data and Worksheets Between Excel Files
Working with multiple Excel files often requires copying data or entire worksheets from one workbook to another. With Spire.XLS for Python, you can perform these operations programmatically using the Workbook and Worksheet classes, allowing you to preserve formatting, formulas, and data structure when consolidating or merging information from different sources.
Steps to copy data and worksheets between Excel workbooks:
- Create a new instance of the Workbook class and load the source Excel file using the Workbook.LoadFromFile(filePath: str) method.
- Create another Workbook instance and clear the default worksheets using the Workbook.Worksheets.Clear() method.
- To copy data only:
- Iterate through worksheets in the source workbook and create new worksheets in the destination using the Workbook.Worksheets.Add(sheetName: str) method.
- Use the Worksheet.Range.get_Item(row, col).Value property to read from the source worksheet and write into the destination worksheet.
- To copy entire worksheets:
- Use the Worksheet.CopyFrom(sourceWorksheet) method to duplicate the content of each source worksheet into a new worksheet.
- Save the new workbook using the Workbook.SaveToFile(filePath: str, ileFormat: FileFormat) method.
- Python
from spire.xls import Workbook, FileFormat

# Create a Workbook object and load an Excel file
workbook = Workbook()
workbook.LoadFromFile("Sample.xlsx")

# Create another Workbook object and load an Excel file
newWorkbook = Workbook()
newWorkbook.Worksheets.Clear()

# Read data from one workbook and insert it into another
for i in range(workbook.Worksheets.get_Item(0).Rows.Count):
    for j in range(workbook.Worksheets.get_Item(0).Columns.Count):
        # Add a new worksheet
        sheet = newWorkbook.Worksheets.Add(workbook.Worksheets.get_Item(0).Name)
        # Write data
        sheet.Range.get_Item(i + 1, j + 1).Value = workbook.Worksheets.get_Item(0).Range.get_Item(i + 1, j + 1).Value

# Copy worksheets from the first workbook to the second workbook
for i in range(workbook.Worksheets.Count):
    # Add a new worksheet
    newSheet = newWorkbook.Worksheets.Add(workbook.Worksheets.get_Item(i).Name + "-Copy")
    # Copy all contents to the new worksheet
    newSheet.CopyFrom(workbook.Worksheets.get_Item(i))

# Save the workbook
newWorkbook.SaveToFile("output/ExcelToExcel.xlsx", FileFormat.Version2016)
workbook.Dispose()
newWorkbook.Dispose()

Import JSON Data into Excel Worksheets
JSON (JavaScript Object Notation) is a popular format for structured data, commonly used in APIs and modern web applications. With Python's built-in json module, you can easily parse JSON files and extract table-like data. This data can then be written into an Excel worksheet using Spire.XLS for Python, which allows you to format, edit, and organize the content for easier analysis, visualization, or sharing.
A code example demonstrates how to import JSON data into Excel files:
- Python
from spire.xls import Workbook, FileFormat, BuiltInStyles
import json

# Load JSON data
with open("Sample.json", "r", encoding="utf-8") as f:
    jsonData = json.load(f)
headers = list(jsonData[0].keys())
rows = [[str(item[key]) for key in headers] for item in jsonData]

# Create a Workbook instance
workbook = Workbook()
# Clear the default worksheets and add new one
workbook.Worksheets.Clear()
sheet = workbook.Worksheets.Add("JSON Data")

# Write headers and rows into the new worksheet
for col, header in enumerate(headers):
    sheet.Range[1, col + 1].Value = header
for row_idx, row_data in enumerate(rows):
    for col_idx, value in enumerate(row_data):
        sheet.Range[row_idx + 2, col_idx + 1].Value = value

# Apply styles and auto-fit columns
sheet.Rows[0].BuiltInStyle = BuiltInStyles.Heading2
for row in range(1, sheet.Rows.Count):
    sheet.Rows[row].BuiltInStyle = BuiltInStyles.Accent2_40
for col in range(sheet.Columns.Count):
    sheet.AutoFitColumn(col + 1)

# Save Excel file
workbook.SaveToFile("output/JSONToExcel.xlsx", FileFormat.Version2016)
workbook.Dispose()

Import XML Data into Excel Worksheets
XML is a widely used format for representing hierarchical data in enterprise systems and data feeds. With Python's xml.etree.ElementTree module, you can navigate and extract the desired elements and attributes. Once the data is retrieved, Spire.XLS for Python allows you to write the data into Excel worksheets, mapping the hierarchical structure into rows and columns. This makes it easier to present, filter, and analyze complex XML content in a tabular format.
The following example shows how to extract XML data and write it into an Excel worksheet with Spire.XLS for Python:
- Python
from spire.xls import Workbook, FileFormat, BuiltInStyles
import xml.etree.ElementTree as ET

# Load XML data
tree = ET.parse("Sample.xml")
root = tree.getroot()
first_order = root.find("order")
headers = [elem.tag.replace('_', ' ').title() for elem in first_order]

rows = [
    [order.find(tag.lower().replace(" ", "_")).text or "" for tag in headers]
    for order in root.findall("order")
]

# Use Spire.XLS for Python to create and write to workbook
workbook = Workbook()
workbook.Worksheets.Clear()
sheet = workbook.Worksheets.Add("XML Data")

# Write headers and rows
for col, header in enumerate(headers):
    sheet.Range[1, col + 1].Value = header

for row_idx, row_data in enumerate(rows):
    for col_idx, value in enumerate(row_data):
        sheet.Range[row_idx + 2, col_idx + 1].Value = value

# Apply styles and auto-fit columns
sheet.Rows[0].BuiltInStyle = BuiltInStyles.Heading4
for row in range(1, sheet.Rows.Count):
    sheet.Rows[row].BuiltInStyle = BuiltInStyles.Accent4_40
for col in range(sheet.Columns.Count):
    sheet.AutoFitColumn(col + 1)

# Save Excel file
workbook.SaveToFile("output/XMLToExcel.xlsx", FileFormat.Version2016)
workbook.Dispose()

Import Database Records into Excel Worksheets
Importing database records into Excel is a common requirement in reporting and business intelligence. You can use database connector libraries in Python, such as sqlite3, pyodbc, or pymysql, to establish connections with various relational databases and retrieve records via SQL queries.
Once data is fetched from the database, it can be written into Excel using the Workbook class and the Worksheet.Range.get_Item().Value property in Spire.XLS. This enables you to convert relational datasets into readable and portable Excel workbooks that are ideal for reports, dashboards, and archival.
An example demonstrates how to fetch rows from a SQLite database and populate an Excel worksheet:
- Python
import sqlite3
from spire.xls import Workbook, FileFormat, BuiltInStyles

# Connect to the SQLite database
conn = sqlite3.connect("Sample.db")
cursor = conn.cursor()

# Get all table names in the database
cursor.execute("SELECT name FROM sqlite_master WHERE type='table';")
tables = [row[0] for row in cursor.fetchall()]

# Create an Excel workbook
workbook = Workbook()
workbook.Worksheets.Clear()  # Clear the default worksheets

# Loop through each table and export to a worksheet
for table_name in tables:
    # Fetch all data from the table
    cursor.execute(f"SELECT * FROM {table_name}")
    rows = cursor.fetchall()
    # Get column names
    column_names = [desc[0] for desc in cursor.description]
    # Add a new worksheet with the table name
    sheet = workbook.Worksheets.Add(table_name)

    # Write header row
    for col_index, column_name in enumerate(column_names):
        cell = sheet.Range.get_Item(1, col_index + 1)
        cell.Value = str(column_name)

    # Write data rows
    for row_index, row in enumerate(rows, start=2):
        for col_index, value in enumerate(row):
            sheet.Range.get_Item(row_index, col_index + 1).Value = str(value)

    # Apply styles
    sheet.Rows.get_Item(0).BuiltInStyle = BuiltInStyles.Heading4
    for i in range(1, sheet.Rows.Count):
        sheet.Rows.get_Item(i).BuiltInStyle = BuiltInStyles.Accent4_20
    for j in range(sheet.Columns.Count):
        sheet.AutoFitColumn(j + 1)

# Close the database connection
conn.close()

# Save the Excel file
workbook.SaveToFile("output/SQDBToExcel.xlsx", FileFormat.Version2016)
workbook.Dispose()

Import HTML Table Data into Excel Worksheets
Many web pages display data in HTML table format. By using the BeautifulSoup library in Python, you can scrape table data from web content and convert it into structured data. This data can then be written into Excel worksheets using the Spire.XLS for Python library.
With optional styling and formatting capabilities, you can preserve the tabular structure and create professional-looking reports from online sources such as stock data, weather updates, or product listings.
A code example demonstrates how to extract table data from HTML and write it into Excel worksheets:
- Python
from bs4 import BeautifulSoup
from spire.xls import Workbook, FileFormat, BuiltInStyles

# Read HTML file
with open("Sample.html", "r", encoding="utf-8") as f:
    soup = BeautifulSoup(f, "html.parser")

# Find the table
table = soup.find("table")
rows = table.find_all("tr")

# Extract data from table as a 2D list
data = []
for row in rows:
    cells = row.find_all(["th", "td"])
    data.append([cell.get_text(strip=True) for cell in cells])

# Create a new Excel workbook
workbook = Workbook()
# Get the first worksheet
sheet = workbook.Worksheets.get_Item(0)

# Iterate through the data
for row_index, row in enumerate(data, start=1):
    for col_index, cell_value in enumerate(row, start=1):
        # Write the table data to the cells in the worksheet
        sheet.Range.get_Item(row_index, col_index).Value = str(cell_value)

# Format the table
sheet.Rows.get_Item(0).BuiltInStyle = BuiltInStyles.Heading4
for i in range(1, sheet.Rows.Count):
    sheet.Rows.get_Item(i).BuiltInStyle = BuiltInStyles.Accent4_20
for j in range(sheet.Columns.Count):
    sheet.AutoFitColumn(j + 1)

# Save the Excel file
workbook.SaveToFile("output/HTMLToExcel.xlsx", FileFormat.Version2016)
workbook.Dispose()

Get a Free License
To fully experience the capabilities of Spire.XLS for Python without any evaluation limitations, you can request a free 30-day trial license.
Modern workflows often span multiple platforms-while analysts work with data in Excel, polished reports are created in Word. Manually copying data between these documents can lead to errors, version conflicts, and inconsistent formatting. Python-driven automation provides an efficient solution by seamlessly integrating Excel's data capabilities with Word's formatting strengths. This integration ensures data integrity, reduces repetitive formatting, and accelerates report creation for financial, academic, and compliance-related tasks.
This article explores how to use Spire.Office for Python to insert Excel tables into Word documents using Python code.
- Read Excel Data and Insert It into Word Documents
- Copy Data and Formatting from Excel to Word
- Integrate Excel Worksheets as OLE into Word Documents
Install Spire.Office for Python
This scenario requires Spire.Office for Python and plum-dispatch v1.7.4. They can be easily installed in your Windows through the following pip command.
pip install Spire.Office
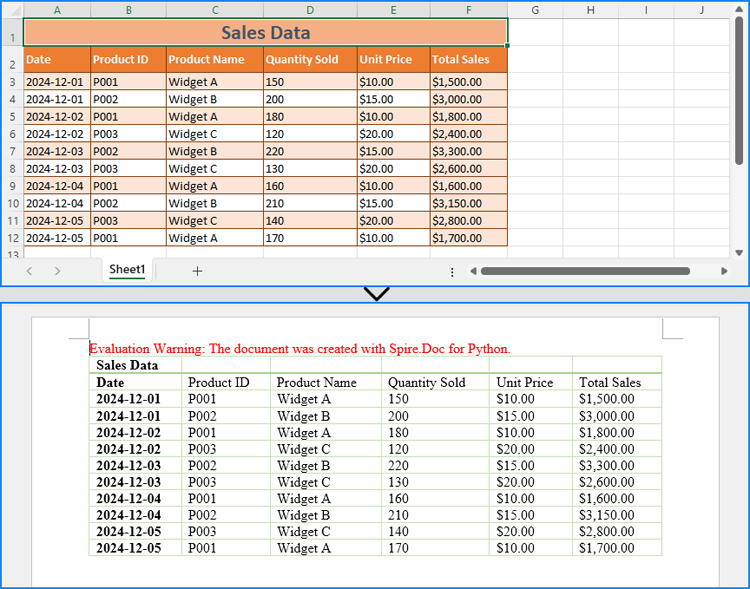
Read Excel Data and Insert It into Word Documents
With Spire.XLS for Python, developers can extract data from Excel worksheets while preserving number formatting using the CellRange.NumberText property. The extracted data can then be inserted into a Word table created using Spire.Doc for Python. This method is ideal for simple Excel worksheets and cases requiring table reformatting.
Steps to Read Excel Data and Insert It into Word:
- Create an instance of the Workbook class and load an Excel file using the Workbook.LoadFromFile() method.
- Retrieve the worksheet using the Workbook.Worksheets.get_Item() method and obtain the used cell range with the Worksheet.AllocatedRange property.
- Initialize a Document instance to create a Word document.
- Add a section using the Document.AddSection() method and insert a table using the Section.AddTable() method.
- Define the number of rows and columns based on the used cell range with the Table.ResetCells() method.
- Iterate through the rows and columns of the used cell range.
- Retrieve the corresponding table cell using the Table.Rows.get_Item().Cells.get_Item() method and add a paragraph using the TableCell.AddParagraph() method.
- Extract the cell value using the CellRange.get_Item().NumberText property and append it to the paragraph using the Paragraph.AppendText() method.
- Apply the required formatting to the Word table.
- Save the Word document using the Document.SaveToFile() method.
- Python
from spire.doc import Document, AutoFitBehaviorType, FileFormat, DefaultTableStyle
from spire.xls import Workbook

# Specify the file names
excel_file = "Sample.xlsx"
word_file = "output/ExcelDataToWord.docx"

# Create a Workbook instance
workbook = Workbook()
# Load the Excel file
workbook.LoadFromFile(excel_file)

# Get the first worksheet
sheet = workbook.Worksheets.get_Item(0)
# Get the used cell range in the first worksheet
allocatedRange = sheet.AllocatedRange

# Create a Document instance
doc = Document()

# Add a section to the document and add a table to the section
section = doc.AddSection()
table = section.AddTable()

# Reset the number of rows and columns in the Word table to match the number of rows and columns in the Excel worksheet
table.ResetCells(allocatedRange.RowCount, allocatedRange.ColumnCount)

# Loop through each row and column in the used cell range
for rowIndex in range(allocatedRange.RowCount):
    # Loop through each column in the row
    for colIndex in range(allocatedRange.ColumnCount):
        # Add a cell to the Word table and add a paragraph to the cell
        cell = table.Rows.get_Item(rowIndex).Cells.get_Item(colIndex)
        paragraph = cell.AddParagraph()
        # Append the cell value to the Word table
        paragraph.AppendText(allocatedRange.get_Item(rowIndex + 1, colIndex + 1).NumberText)

# Auto-fit the table to the window and apply a table style
table.AutoFit(AutoFitBehaviorType.AutoFitToWindow)
table.ApplyStyle(DefaultTableStyle.GridTable1LightAccent6)

# Save the Word document
doc.SaveToFile(word_file, FileFormat.Docx2019)

# Dispose resources
doc.Dispose()
workbook.Dispose()
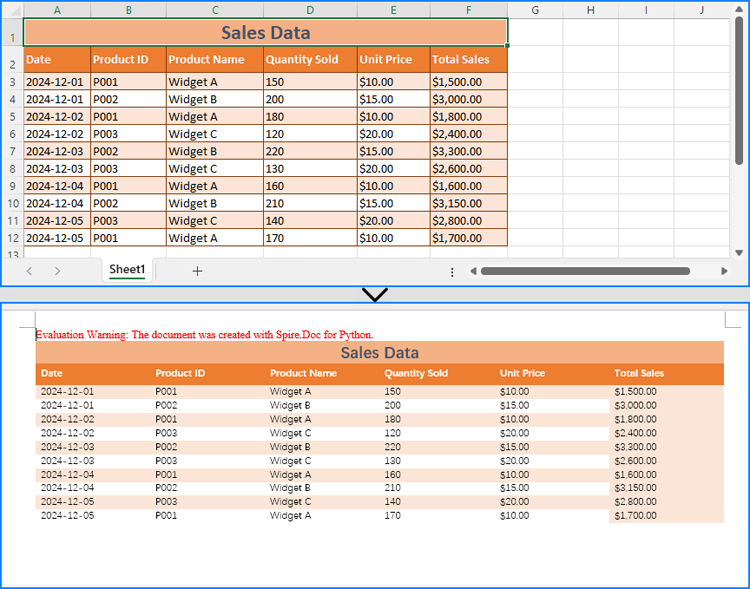
Copy Data and Formatting from Excel to Word
Spire.XLS for Python and Spire.Doc for Python can also be used together to copy both data and formatting from Excel to Word, preserving the table's original structure and appearance.
To handle format preservation, two helper methods are needed:
- MergeCells: Merges table cells in Word according to the merged cells in the Excel worksheet.
- CopyFormatting: Copies Excel cell formatting (font style, background color, horizontal and vertical alignment) to the Word table.
Steps to Copy Data and Formatting:
- Create a Workbook instance and load an Excel file using the Workbook.LoadFromFile() method.
- Retrieve a worksheet using the Workbook.Worksheets.get_Item() method.
- Initialize a Document instance and add a section with the Document.AddSection() method.
- Insert a table using the Section.AddTable() method.
- Adjust the table’s structure based on the worksheet using the Table.ResetCells() method.
- Apply cell merging using the MergeCells() method.
- Iterate through each worksheet row and set row heights using the Table.Rows.get_Item().Height property.
- For each column in a row:
- Retrieve worksheet cells using the Worksheet.Range.get_Item() method and table cells using the TableRow.Cells.get_Item() method.
- Extract cell data using the CellRange.NumberText property and append it to the table cell using the TableCell.AddParagraph().AppendText() method.
- Apply formatting using the CopyFormatting() method.
- Save the Word document using the Document.SaveToFile() method.
- Python
from spire.xls import Workbook, HorizontalAlignType, ExcelPatternType, VerticalAlignType
from spire.doc import Document, Color, HorizontalAlignment, VerticalAlignment, PageOrientation, FileFormat

def MergeCells(worksheet, wordTable):
    # Check if there are merged cells
    if not worksheet.HasMergedCells:
        return
    for cell_range in worksheet.MergedCells:
        start_row, start_col = cell_range.Row, cell_range.Column
        row_count, col_count = cell_range.RowCount, cell_range.ColumnCount
        # Process horizontal merging
        if col_count > 1:
            for row in range(start_row, start_row + row_count):
                wordTable.ApplyHorizontalMerge(row - 1, start_col - 1, start_col - 1 + col_count - 1)
        # Process vertical merging
        if row_count > 1:
            wordTable.ApplyVerticalMerge(start_col - 1, start_row - 1, start_row - 1 + row_count - 1)

def CopyFormatting(tableTextRange, excelCell, wordCell):
    # Copy font styles
    font = excelCell.Style.Font
    tableTextRange.CharacterFormat.TextColor = Color.FromRgb(font.Color.R, font.Color.G, font.Color.B)
    tableTextRange.CharacterFormat.FontSize = float(font.Size)
    tableTextRange.CharacterFormat.FontName = font.FontName
    tableTextRange.CharacterFormat.Bold = font.IsBold
    tableTextRange.CharacterFormat.Italic = font.IsItalic
    # Copy background colors
    if excelCell.Style.FillPattern != ExcelPatternType.none:
        wordCell.CellFormat.BackColor = Color.FromRgb(excelCell.Style.Color.R, excelCell.Style.Color.G,
                                                      excelCell.Style.Color.B)
    # Copy the horizontal alignment
    hAlignMap = {
        HorizontalAlignType.Left: HorizontalAlignment.Left,
        HorizontalAlignType.Center: HorizontalAlignment.Center,
        HorizontalAlignType.Right: HorizontalAlignment.Right
    }
    if excelCell.HorizontalAlignment in hAlignMap:
        tableTextRange.OwnerParagraph.Format.HorizontalAlignment = hAlignMap[excelCell.HorizontalAlignment]
    # Copy the vertical alignment
    vAlignMap = {
        VerticalAlignType.Top: VerticalAlignment.Top,
        VerticalAlignType.Center: VerticalAlignment.Middle,
        VerticalAlignType.Bottom: VerticalAlignment.Bottom
    }
    if excelCell.VerticalAlignment in vAlignMap:
        wordCell.CellFormat.VerticalAlignment = vAlignMap[excelCell.VerticalAlignment]

# Specify the file names
excelFileName = "Sample.xlsx"
wordFileName = "output/ExcelDataFormatToWord.docx"

# Create a Workbook instance and load the Excel file
workbook = Workbook()
workbook.LoadFromFile(excelFileName)

# Get a worksheet
sheet = workbook.Worksheets.get_Item(0)

# Create a Document instance
doc = Document()
# Add a section to the document and set the page orientation
section = doc.AddSection()
section.PageSetup.Orientation = PageOrientation.Landscape

# Add a table to the section
table = section.AddTable()
# Set the number of rows and columns according to the number of rows and columns in the Excel worksheet
table.ResetCells(sheet.LastRow, sheet.LastColumn)

# Execute the MergeCells method to merge cells
MergeCells(sheet, table)

# Iterate through each row and column in the Excel worksheet
for r in range(1, sheet.LastRow + 1):
    tableRow = table.Rows.get_Item(r - 1)
    tableRow.Height = float(sheet.Rows.get_Item(r - 1).RowHeight)
    for c in range(1, sheet.LastColumn + 1):
        # Get the corresponding cell in the Excel worksheet and the cell in the Word table
        eCell = sheet.Range.get_Item(r, c)
        wCell = table.Rows.get_Item(r - 1).Cells.get_Item(c - 1)
        # Append the cell value to the Word table
        textRange = wCell.AddParagraph().AppendText(eCell.NumberText)
        # Copy the cell formatting
        CopyFormatting(textRange, eCell, wCell)

# Save the Word document
doc.SaveToFile(wordFileName, FileFormat.Docx2019)
doc.Dispose()
workbook.Dispose()
Integrate Excel Worksheets as OLE into Word Documents
Beyond copying data and formatting, Excel worksheets can be embedded as OLE objects in Word documents. This approach enables full worksheet visualization and allows users to edit Excel data directly from the Word document.
Using the Paragraph.AppendOleObject(str: filename, DocPicture, OleObjectType.ExcelWorksheet) method, developers can easily insert an Excel file as an OLE object.
Steps to Insert an Excel Worksheet as an OLE Object:
- Create a Workbook instance and load an Excel file using the Workbook.LoadFromFile() method.
- Retrieve a worksheet using the Workbook.Worksheets.get_Item() method and save it as an image using the Worksheet.ToImage().Save() method.
- Initialize a Document instance to create a Word document.
- Add a section using the Document.AddSection() method and insert a paragraph using the Section.AddParagraph() method.
- Create a DocPicture instance and load the saved image using the DocPicture.LoadImage() method.
- Resize the image according to the page layout using the DocPicture.Width property.
- Insert the Excel file as an OLE object into the paragraph using the Paragraph.AppendOleObject() method.
- Set the DocOleObject.DisplayAsIcon property to False to ensure that the OLE object updates dynamically after worksheet edits.
- Save the Word document using the Document.SaveToFile() method.
- Python
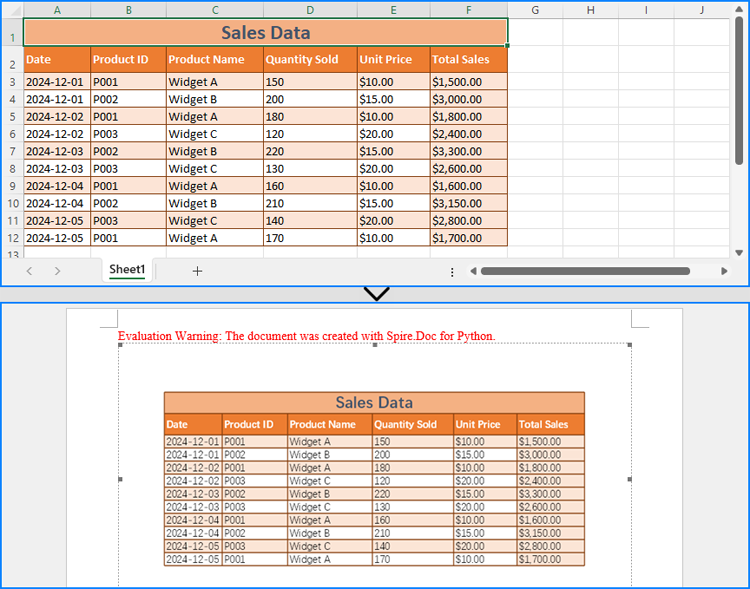
from spire.doc import Document, DocPicture, FileFormat, OleObjectType
from spire.xls import Workbook

# Specify the file path and names
excelFileName = "Sample.xlsx"
wordFileName = "output/ExcelOleToWord.docx"
tempImageName = "SheetImage.png"

# Create a Workbook instance and load the Excel file
workbook = Workbook()
workbook.LoadFromFile(excelFileName)

# Save the first worksheet as an image
sheet = workbook.Worksheets.get_Item(0)
sheet.ToImage(1, 1, sheet.LastRow, sheet.LastColumn).Save(tempImageName)

# Initialize a Document instance to create a Word document
doc = Document()
# Add a section to the document and add a paragraph to the section
section = doc.AddSection()
paragraph = section.AddParagraph()

# Create a DocPicture instance and load the image
pic = DocPicture(doc)
pic.LoadImage(tempImageName)

# Set the image width
pic.Width = section.PageSetup.PageSize.Width - section.PageSetup.Margins.Left - section.PageSetup.Margins.Right

# Insert the Excel file into the Word document as an OLE object and set the saved image as the display image
ole = paragraph.AppendOleObject(excelFileName, pic, OleObjectType.ExcelWorksheet)
# Set to not display the OLE object as an icon
ole.DisplayAsIcon = False

# Save the Word document
doc.SaveToFile(wordFileName, FileFormat.Docx2019)
workbook.Dispose()
doc.Dispose()
Get a Free License
To fully experience the capabilities of Install Spire.Office for Python without any evaluation limitations, you can request a free 30-day trial license.
Word documents often contain extensive text, and applying emphasis marks is an effective way to highlight key information. Whether you need to accentuate important terms or enhance text clarity with styled formatting, emphasis marks can make your content more readable and professional. Instead of manually adjusting formatting, this guide demonstrates how to use Spire.Doc for Python to efficiently apply emphasis to text in Word with Python, saving time while ensuring a polished document.
- Apply Emphasis Marks to First Matched Text
- Apply Emphasis Marks to All Matched Text
- Apply Emphasis Marks to Text with Regular Expression
Install Spire.Doc for Python
This scenario requires Spire.Doc for Python and plum-dispatch v1.7.4. They can be easily installed in your Windows through the following pip command.
pip install Spire.Doc
If you are unsure how to install, please refer to this tutorial: How to Install Spire.Doc for Python on Windows.
Apply Emphasis Marks to First Matched Text in Word Documents
When crafting a Word document, highlighting keywords or phrases can improve readability and draw attention to important information. With Spire.Doc's CharacterFormat.EmphasisMark property, you can easily apply emphasis marks to any text, ensuring clarity and consistency.
Steps to apply emphasis marks to the first matched text in a Word document:
- Create an object of the Document class.
- Load a source Word document from files using Document.LoadFromFile() method.
- Find the text that you want to emphasize with Document.FindString() method.
- Apply emphasis marks to the text through CharacterFormat.EmphasisMark property.
- Save the updated Word document using Document.SaveToFile() method.
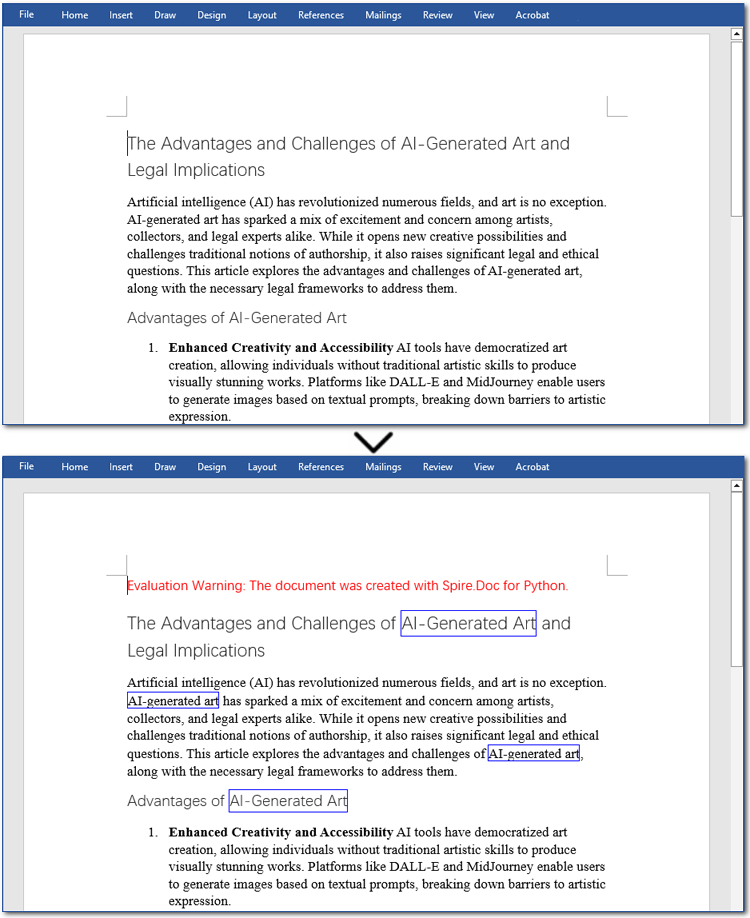
Below is the code example showing how to emphasize the first matching text of "AI-Generated Art" in a Word document:
- Python
from spire.doc import *
from spire.doc.common import *

# Create a Document object
doc = Document()
doc.LoadFromFile("/AI-Generated Art.docx")

# Customize the text that you want to apply an emphasis mark to
matchingtext = doc.FindString("AI-Generated Art", True, True)

# Apply the emphasis mark to the matched text
matchingtext.GetAsOneRange().CharacterFormat.EmphasisMark = Emphasis.CommaAbove

# Save the document as a new one
doc.SaveToFile("/ApplyEmphasisMark_FirstMatch.docx", FileFormat.Docx2013)
doc.Close()

Apply Emphasis Marks to All Matched Text in Word Files
In the previous section, we demonstrated how to add an emphasis mark to the first matched text. Now, let's take it a step further—how can we emphasize all occurrences of a specific text? The solution is simple: use the Document.FindAllString() method to locate all matches and then apply emphasis marks using the CharacterFormat.EmphasisMark property. Below, you'll find detailed steps and code examples to guide you through the process.
Steps to apply emphasis marks to all matched text:
- Create an instance of Document class.
- Read a Word file through Document.LoadFromFile() method.
- Find all the matching text using Document.FindAllString() method.
- Loop through all occurrences and apply the emphasis effect to the text through CharacterFormat.EmphasisMark property.
- Save the modified Word document through Document.SaveToFile() method.
The following code demonstrates how to apply emphasis to all occurrences of "AI-Generated Art" while ignoring case sensitivity:
- Python
from spire.doc import *
from spire.doc.common import *

# Create a Document object
doc = Document()
doc.LoadFromFile("/AI-Generated Art.docx")

# Customize the text that you want to apply an emphasis mark to
textselections = doc.FindAllString("AI-Generated Art", False, True)

# Loop through the text selections and apply the emphasis mark to the text
for textselection in textselections:
    textselection.GetAsOneRange().CharacterFormat.EmphasisMark = Emphasis.CircleAbove

# Save the document as a new one
doc.SaveToFile("/ApplyEmphasisMark_AllMatch.docx", FileFormat.Docx2013)
doc.Close()
Apply Emphasis Marks to Text in Word Documents with Regular Expression
Sometimes, the text you want to highlight may vary but follow a similar structure, such as email addresses, phone numbers, dates, or patterns like two to three words followed by special symbols (#, *, etc.). The best way to identify such text is by using regular expressions. Once located, you can apply emphasis marks using the same method. Let's go through the steps!
Steps to apply emphasis marks to text using regular expressions:
- Create a Document instance.
- Load a Word document from the local storage using Document.LoadFromFile() method.
- Find text that you want to emphasize with Document.FindAllPattern() method.
- Iterate through all occurrences and apply the emphasis effect to the text through CharacterFormat.EmphasisMark property.
- Save the resulting Word file through Document.SaveToFile() method.
The code example below shows how to emphasize "AI" and the word after it in a Word document:
- Python
from spire.doc import *
from spire.doc.common import *

# Create a Document object
doc = Document()
doc.LoadFromFile("/AI-Generated Art.docx")

# Match "AI" and the next word using regular expression
pattern = Regex(r"AI\s+\w+")

# Find all matching text
textSelections = doc.FindAllPattern(pattern)

# Loop through all the matched text and apply an emphasis mark
for selection in textSelections:
    selection.GetAsOneRange().CharacterFormat.EmphasisMark = Emphasis.DotBelow

# Save the document as a new one
doc.SaveToFile("/ApplyEmphasisMark_Regex.docx", FileFormat.Docx2013)
doc.Close()

Get a Free License
To fully experience the capabilities of Spire.Doc for Python without any evaluation limitations, you can request a free 30-day trial license.
Adding borders to specific text and paragraphs in Word documents is an effective way to highlight key information and improve the document's structure. Whether it's important terms or entire sections, borders help them stand out. In this guide, we'll show you how to use Spire.Doc for Python to add borders to text and paragraphs in Word with Python, boosting both the readability and professionalism of your document while saving you time from manual formatting.
Install Spire.Doc for Python
This scenario requires Spire.Doc for Python and plum-dispatch v1.7.4. They can be easily installed in your Windows through the following pip command.
pip install Spire.Doc
If you are unsure how to install, please refer to this tutorial: How to Install Spire.Doc for Python on Windows.
Add a Border to Text in Word Documents with Python
In Word documents, important information like technical terms, company names, or legal clauses can be highlighted with borders to draw readers' attention. Using Python, you can locate the required text with the Document.FindAllString() method and apply borders using the CharacterFormat.Border.BorderType property. Here's a step-by-step guide to help you do this efficiently.
Steps to add borders to all matched text in a Word document:
- Create an object of Document class.
- Read a source Word document from files using Document.LoadFromFile() method.
- Find all occurrences of the specified text through Document.FindAllString() method.
- Loop through all matched text and get the text as a text range.
- Add a border to the text with CharacterFormat.Border.BorderType property.
- Customize the color of the border through CharacterFormat.Border.Color property.
- Save the modified document with Document.SaveToFile() method.
The code example below shows how to add a border to all occurrences of "AI-Generated Art":
- Python
from spire.doc import *
from spire.doc.common import *

# Create a Document object
doc = Document()
doc.LoadFromFile("/AI-Generated Art.docx")

# Set the target text
target_text = "AI-Generated Art"
# Create a TextSelection object and find all matches
text_selections = doc.FindAllString(target_text, False, True)

# Loop through the text selections
for selection in text_selections:
    text_range = selection.GetAsOneRange()
    # Add a border to the text
    text_range.CharacterFormat.Border.BorderType = BorderStyle.Single
    # Set the border color
    text_range.CharacterFormat.Border.Color = Color.get_Blue()

# Save the resulting document
doc.SaveToFile("/AddBorder_Text.docx", FileFormat.Docx2013)
doc.Close()
Add a Border to Paragraphs in Word Files Using Python
Important clauses or legal statements in contracts, summaries in reports, and quotations in papers often require adding borders to paragraphs for emphasis or distinction. Unlike text borders, adding a border to a paragraph involves finding the target paragraph by its index and then using the Format.Borders.BorderType property. Let's check out the detailed instructions.
Steps to add a border to paragraphs in Word documents:
- Create a Document instance.
- Read a Word document through Document.LoadFromFile() method.
- Get the specified paragraph with Document.Sections[].Paragraphs[] property.
- Add a border to the paragraph using Format.Borders.BorderType property.
- Set the type and color of the border.
- Save the resulting Word file through Document.SaveToFile() method.
Here is an example showing how to add a border to the fourth paragraph in a Word document:
- Python
from spire.doc import *
from spire.doc.common import *

# Create a Document object
doc = Document()
doc.LoadFromFile("/AI-Generated Art.docx")

# Get the fourth paragraph
paragraph = doc.Sections[0].Paragraphs[3]

# Add a border to the paragraph
borders = paragraph.Format.Borders
borders.BorderType(BorderStyle.DotDotDash)
borders.Color(Color.get_Blue())

# Save the updated document
doc.SaveToFile("/AddBorder_Paragraph.docx", FileFormat.Docx2013)
doc.Close()

Get a Free License
To fully experience the capabilities of Spire.Doc for Python without any evaluation limitations, you can request a free 30-day trial license.
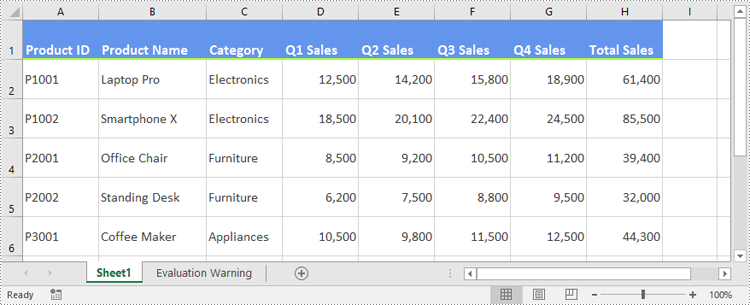
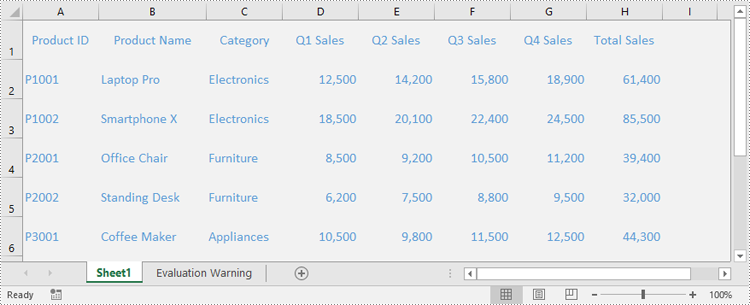
Applying styles is one of the simplest ways to enhance the professionalism and readability of Excel spreadsheets. Excel provides a wide range of built-in styles that allow users to quickly format cells, ranges, or worksheets. Additionally, users can create custom styles to specify fonts, colors, borders, number formats, and more, tailored to their individual preferences. Whether you're designing professional reports, sales presentations, or project management plans, knowing how to use styles effectively helps make data more visually appealing and easier to understand.
In this guide, you will learn how to apply styles to cells or worksheets in Excel in Python using Spire.XLS for Python.
- Apply a Built-in Style to Cells in Excel in Python
- Apply a Custom Style to Cells in Excel in Python
- Apply a Custom Style to a Worksheet in Excel in Python
Install Spire.XLS for Python
This scenario requires Spire.XLS for Python and plum-dispatch v1.7.4. They can be easily installed in your Windows through the following pip command.
pip install Spire.XLS
If you are unsure how to install, please refer to this tutorial: How to Install Spire.XLS for Python on Windows
Apply a Built-in Style to Cells in Excel in Python
Spire.XLS for Python offers the CellRange.BuiltInStyle property, which enables developers to apply built-in styles, such as Title, Heading 1, and Heading 2 to individual cells or ranges in Excel. The detailed steps are as follows.
- Create an object of the Workbook class.
- Load an Excel file using the Workbook.LoadFromFile() method.
- Get a specific worksheet by its index using the Workbook.Worksheets[index] property.
- Get the desired cell or range of cells using the Worksheet.Range[] property.
- Apply a built-in style to the cell or range of cells using the CellRange.BuiltInStyle property.
- Save the resulting file using the Workbook.SaveToFile() method.
- Python
from spire.xls import *
from spire.xls.common import *

# Create an object of the Workbook class
workbook = Workbook()
# Load the Excel file
workbook.LoadFromFile("Sample.xlsx")

# Get the first sheet
sheet = workbook.Worksheets[0]

# Get the desired cell range
range = sheet.Range["A1:H1"]
# Apply a built-in style to the cell range
range.BuiltInStyle = BuiltInStyles.Heading2

# Save the resulting file
workbook.SaveToFile("ApplyBuiltinStyle.xlsx", ExcelVersion.Version2016)
workbook.Dispose()
Apply a Custom Style to Cells in Excel in Python
Developers can use the Workbook.Styles.Add() method to create a custom style, which can then be applied to individual cells or ranges using the CellRange.Style property. The detailed steps are as follows.
- Create an object of the Workbook class.
- Load an Excel file using the Workbook.LoadFromFile() method.
- Get a specific worksheet by its index using the Workbook.Worksheets[index] property.
- Get the desired cell or range of cells using the Worksheet.Range[] property.
- Add a custom style to the workbook using the Workbook.Styles.Add() method.
- Define the formatting, such as the font size, font color, text alignment, cell borders and cell background color, using the properties of the CellStyle class.
- Apply the custom style to the cell or range of cells using the CellRange.Style property.
- Save the resulting file using the Workbook.SaveToFile() method.
- Python
from spire.xls import *
from spire.xls.common import *

# Create an object of the Workbook class
workbook = Workbook()
# Load the Excel file
workbook.LoadFromFile("Sample.xlsx")

# Get the first sheet
sheet = workbook.Worksheets[0]

# Get the desired cell range
range = sheet.Range["A1:H1"]

# Add a custom style to the workbook
style = workbook.Styles.Add("CustomCellStyle")
# Set the font size
style.Font.Size = 13
# Set the font color
style.Font.Color = Color.get_White()
# Bold the text
style.Font.IsBold = True
# Set the vertical text alignment
style.VerticalAlignment = VerticalAlignType.Bottom
# Set the horizontal text alignment
style.HorizontalAlignment = HorizontalAlignType.Left
# Set the bottom border color
style.Borders[BordersLineType.EdgeBottom].Color = Color.get_GreenYellow()
# Set the bottom border type
style.Borders[BordersLineType.EdgeBottom].LineStyle = LineStyleType.Medium
# Set the background color
style.Color = Color.get_CornflowerBlue()

# Apply the custom style to the cell range
range.Style = style

# Save the resulting file
workbook.SaveToFile("ApplyCustomStyle.xlsx", ExcelVersion.Version2016)
workbook.Dispose()
Apply a Custom Style to a Worksheet in Excel in Python
In certain cases, it may be necessary to apply a custom style to an entire worksheet rather than to specific cells or ranges. This can be accomplished using the Worksheet.ApplyStyle() method. The detailed steps are as follows.
- Create an object of the Workbook class.
- Load an Excel file using the Workbook.LoadFromFile() method.
- Get a specific worksheet by its index using the Workbook.Worksheets[index] property.
- Add a custom style to the workbook using the Workbook.Styles.Add() method.
- Define the formatting, such as the font size, font color, and cell background color, using the properties of the CellStyle class.
- Apply the custom style to the worksheet using the Worksheet.ApplyStyle() method.
- Save the resulting file using the Workbook.SaveToFile() method.
- Python
from spire.xls import *
from spire.xls.common import *

# Create an object of the Workbook class
workbook = Workbook()
# Load the Excel file
workbook.LoadFromFile("Sample.xlsx")

# Get the first sheet
sheet = workbook.Worksheets[0]

# Add a custom style to the workbook
style = workbook.Styles.Add("CustomSheetStyle")
# Set the font size
style.Font.Size = 12
# Set the font color
style.Font.Color = Color.FromRgb(91, 155, 213)
# Set the cell background color
style.Color = Color.FromRgb(242, 242, 242)

# Apply the custom style to the worksheet
sheet.ApplyStyle(style)

# Save the resulting file
workbook.SaveToFile("ApplyCustomStyleToSheet.xlsx", ExcelVersion.Version2016)
workbook.Dispose()
Apply for a Temporary License
If you'd like to remove the evaluation message from the generated documents, or to get rid of the function limitations, please request a 30-day trial license for yourself.
Python: Check if a PDF is Password Protected and Determine the Correct Password
2025-03-19 01:06:07 Written by KoohjiWhen working with PDF files, you may encounter documents that are password protected. This means that you cannot view or edit the content without entering the correct password. Understanding how to check if a PDF is password protected and determining the correct password is essential for accessing important information. In this guide, we will introduce how to check if a PDF is password protected and determine the correct password using Python and the Spire.PDF for Python library.
Install Spire.PDF for Python
This scenario requires Spire.PDF for Python and plum-dispatch v1.7.4. They can be easily installed in your Windows through the following pip command.
pip install Spire.PDF
If you are unsure how to install, please refer to this tutorial: How to Install Spire.PDF for Python on Windows
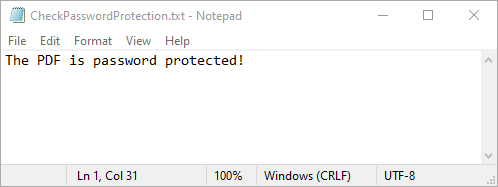
Check if a PDF is Password Protected
Spire.PDF for Python offers the PdfDocument.IsPasswordProtected(fileName: str) method to check if a PDF file is password protected. The detailed steps are as follows.
- Specify the input and output file paths.
- Check if the PDF file is password protected or not using the PdfDocument.IsPasswordProtected() method.
- Save the result to a text file.
- Python
from spire.pdf import *

# Specify the input and output file paths
inputFile = "Secured.pdf"
outputFile = "CheckPasswordProtection.txt"

# Check if the input PDF file is password protected
isProtected = PdfDocument.IsPasswordProtected(inputFile)

# Write the result into a text file
with open(outputFile, "w") as fp:
    fp.write("The PDF is " + ("password protected!" if isProtected else "not password protected!"))
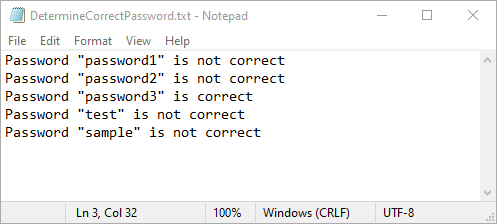
Determine the Correct Password for a PDF
While Spire.PDF for Python does not provide a direct method to check if a password is correct, you can achieve this by attempting to load the PDF with the password and catching exceptions. If the password is incorrect, an exception will be thrown. The detailed steps are as follows.
- Specify the input and output file paths.
- Create a list of potential passwords to test.
- Iterate through the list and load the PDF with each password using the PdfDocument.LoadFromFile(filename: str, password: str) method.
- If no exception is thrown, the password is correct. Otherwise, the password is incorrect.
- Save the results to a text file.
- Python
from spire.pdf import *

# Specify the input and output file paths
inputFile = "Secured.pdf"
outputFile = "DetermineCorrectPassword.txt"

# Create a list of potential passwords to test
passwords = ["password1", "password2", "password3", "test", "sample"]

# Create a text file to store the results
with open(outputFile, "w") as fp:
    for value in passwords:
        try:
            # Load the PDF with the current password
            doc = PdfDocument()
            doc.LoadFromFile(inputFile, value)
            # If successful, write that the password is correct
            fp.write(f'Password "{value}" is correct\n')
        except SpireException:
            # If an exception occurs, write that the password is not correct
            fp.write(f'Password "{value}" is not correct\n')
Apply for a Temporary License
If you'd like to remove the evaluation message from the generated documents, or to get rid of the function limitations, please request a 30-day trial license for yourself.