Charts are an essential tool for visualizing data stored in Excel spreadsheets. Creating charts from your spreadsheet data can reveal trends, patterns, and insights that might be missed in a simple table of numbers. With Spire.Cloud.Excel, an online spreadsheet editor, you can easily convert your Excel data to various types of charts. This guide will walk you through the process of how to convert Excel data with charts online using Spire.Cloud.Excel.
- Spire.Cloud.Excel Spreadsheet Editor
- Chart Types Supported by Spire.Cloud.Excel Spreadsheet Editor
- Convert Excel Data to Charts Online
Spire.Cloud.Excel Spreadsheet Editor
Spire.Cloud.Excel is one of the key components of the Spire.Cloud.Office online suite. This robust online spreadsheet editor empowers users to create, view, edit, convert and collaborate on Excel-compatible spreadsheets directly in their web browsers. It offers a wide range of features, including data analysis tools, formula support, chart creation, and formatting options. With a variety of chart types and customization options, Spire.Cloud.Excel makes data visualization straightforward and effective.
To utilize the services offered by Spire.Cloud.Excel, you first need to install Spire.Cloud.Office on your system:
- Install Spire.Cloud.Office for .NET on Windows
- Install Spire.Cloud.Office for Linux on Ubuntu
- Install Spire.Cloud.Office for Linux on CentOS
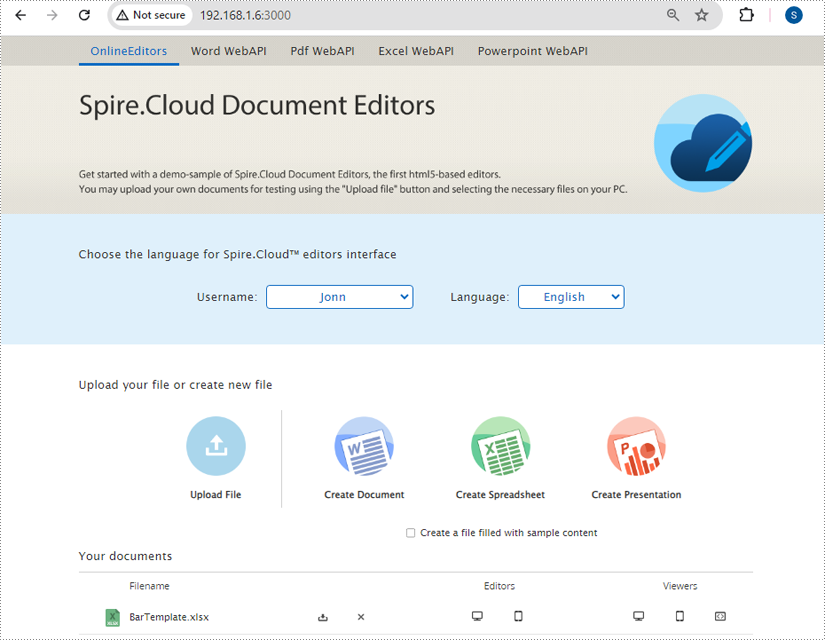
After the installation is complete, you can integrate Spire.Cloud.Office in your own web application or visit the example application hosted on port 3000 (as shown in the image below) to explore the editor's functionality.
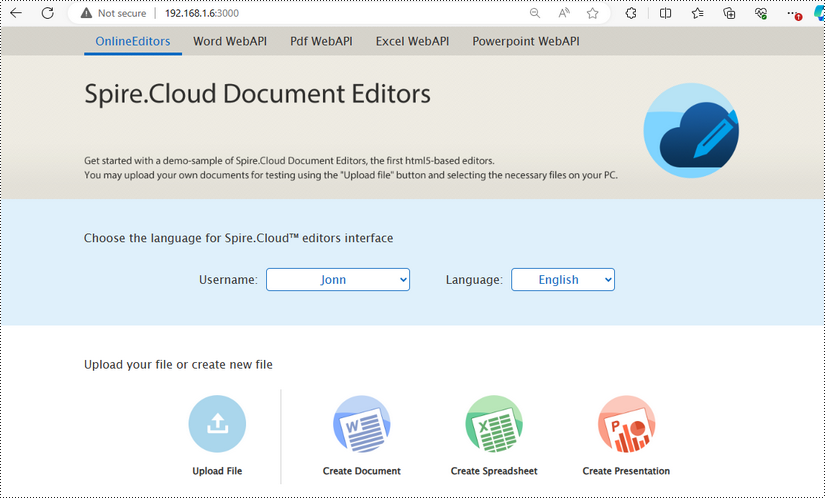
Chart Types Supported by Spire.Cloud.Excel Spreadsheet Editor
Spire.Cloud.Excel Spreadsheet Editor supports a wide range of chart types, allowing you to choose the best visual representation for your data. Here are some of the chart types you can use:
- Column Chart: Ideal for comparing quantities across different categories. Each category is represented by a vertical bar, making it easy to see differences at a glance. This type of chart is perfect for displaying data like sales figures or population statistics.
- Line Chart: Perfect for showing trends over time. Line charts plot data points connected by a straight line, making them great for tracking changes over periods such as months or years. They are commonly used for financial data, such as stock prices or revenue growth.
- Pie Chart: Useful for displaying proportions and percentages. A pie chart divides a circle into slices to illustrate numerical proportions. Each slice represents a category's contribution to the whole, making it easy to compare parts of a whole.
- Bar Chart: Similar to column charts but with horizontal bars. Bar charts are useful for comparing quantities across categories, especially when the category names are long or there are many categories. They are often used for survey data or inventory levels.
- Area Chart: Great for emphasizing the magnitude of change over time. Area charts are similar to line charts, but the area below the line is filled with color, highlighting the volume of change. They are ideal for showing cumulative totals over time, such as total sales or production levels.
- XY (Scatter) Chart: Used for showing the relationship between two variables. Scatter charts plot individual data points on a grid, with one variable on the x-axis and the other on the y-axis. This type of chart is excellent for identifying correlations or trends between two datasets, such as height versus weight.
- Stock Chart: Suitable for financial data, representing stock prices and market trends. Stock charts can display various financial metrics, such as opening, closing, high, and low prices for a particular period. They are essential for investors and analysts who need to track market movements and make informed decisions.
Each chart type comes with customization options to enhance your data visualization further, allowing you to adjust colors, labels, and other elements to create the most informative and visually appealing charts for your needs.
Convert Excel Data to Chart Online
To convert Excel data to charts online using Spire.Cloud.Excel, you can follow the steps below.
1. Open Your Excel File
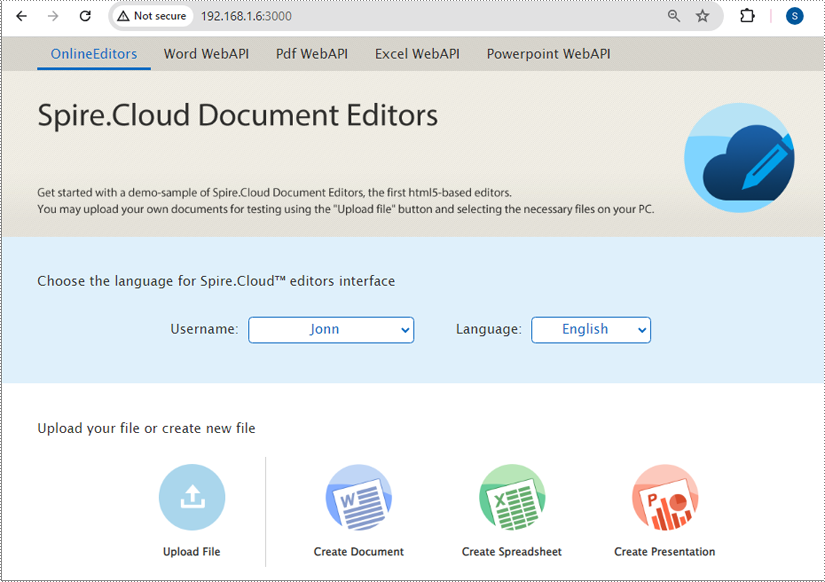
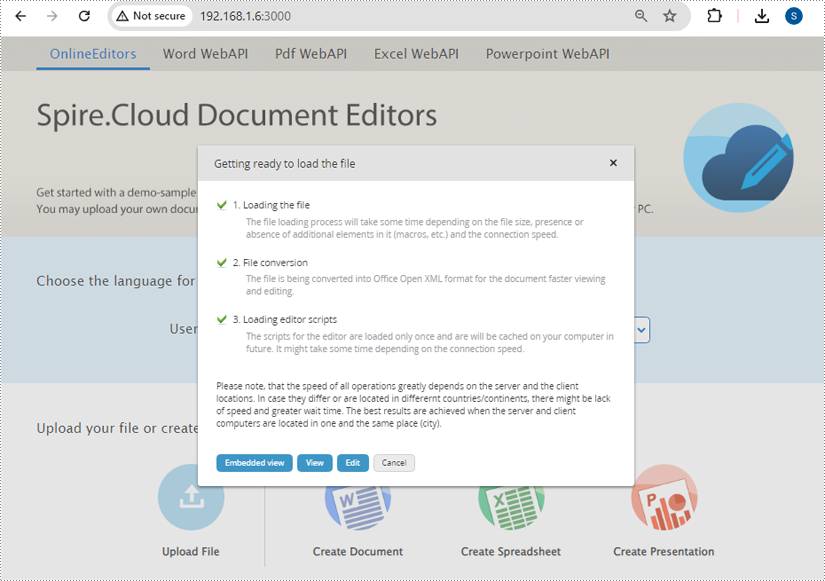
- First, you need to upload your Excel file by clicking the "Upload File" button on the example page.
- Once the file is uploaded, click the "Edit" button to open it in the Spire.Cloud.Excel Spreadsheet Editor.
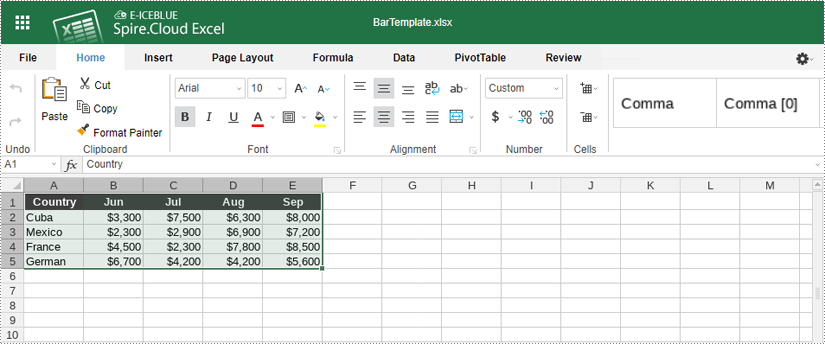
2. Select Your Data
To create a chart, you need to select the data that you want to visualize:
- Click and drag to highlight the cells containing the data you want to include in your chart.
- Ensure you include headers in your selection if you want them to appear in the chart's legend.
3. Insert a Chart
With your data selected, follow these steps to insert a chart:
- Go to the "Insert" tab in the toolbar of Spire.Cloud.Excel Spreadsheet Editor.
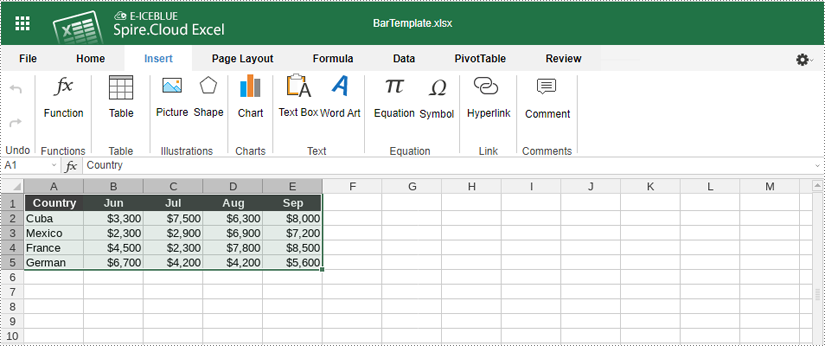
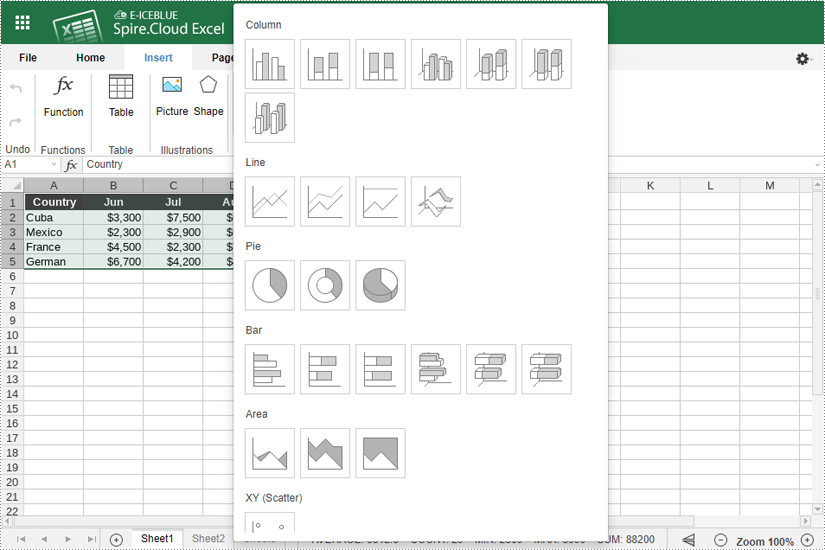
- Click the "Chart" icon. This will open a menu with various chart types. Then Choose the chart type that best represents your data (e.g., bar chart, line chart, pie chart, column chart, XY (scatter chart), area chart).
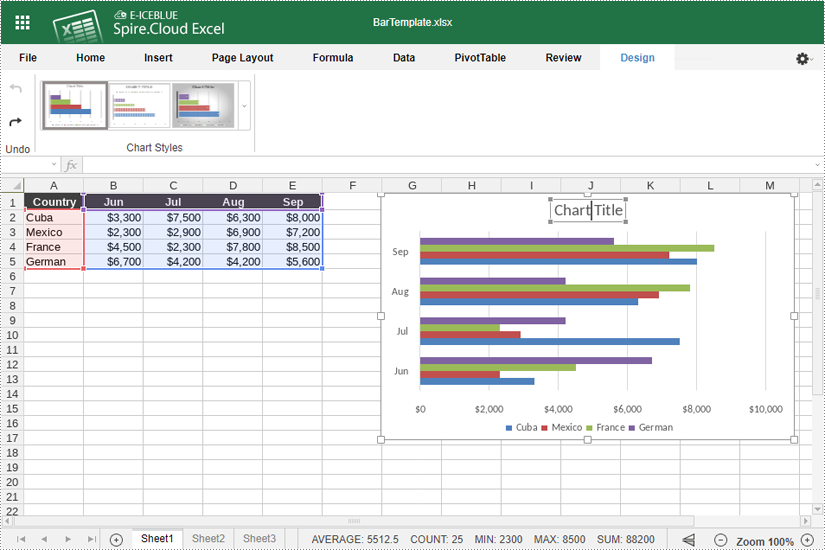
4. Customize Your Chart
Spire.Cloud.Excel provides numerous options to customize your chart:
- After inserting the chart, click the "Chart Title" to add a title for it.
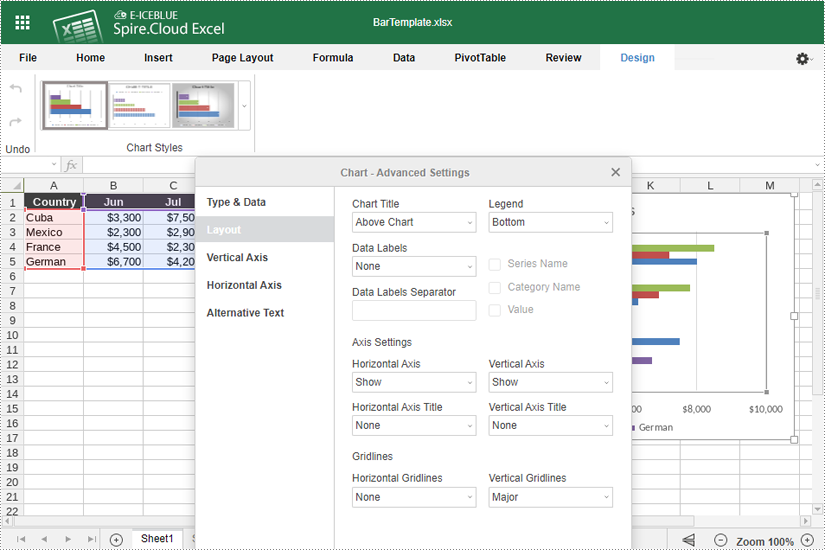
- Right-click the chart and select "Chart Advanced Settings".

- Use the options available to modify the chart's design, such as changing the chart title and legend position, adding data labels, and adjusting horizontal and vertical axes.
- If you want to change the chart type, right-click the chart and select "Chart Format". Then click "Chart" > "Change Chart Type".
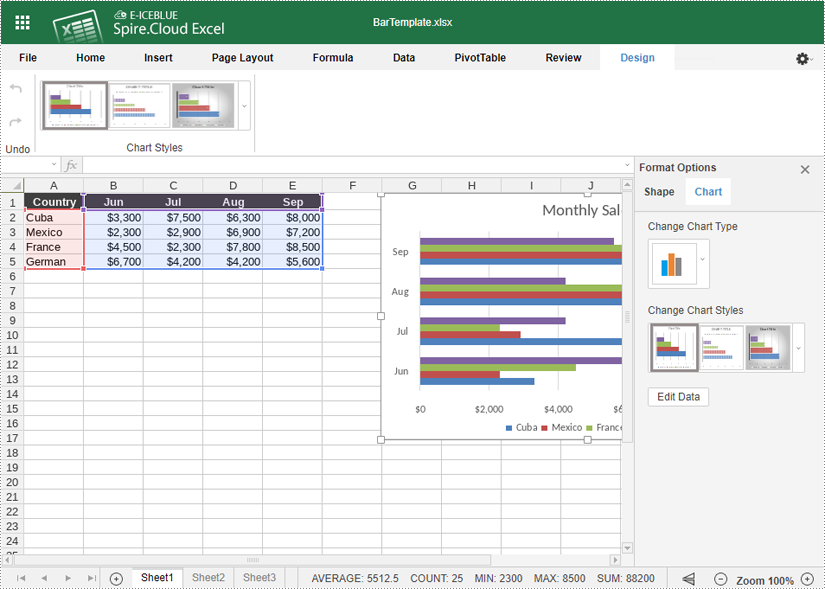
- You can also resize and move the chart within your spreadsheet by clicking and dragging.
5. Save Your Chart
- Once you are satisfied with your chart, you can save your document by pressing "Ctrl + S" or clicking on the "File" menu and selecting "Save" to save your changes.
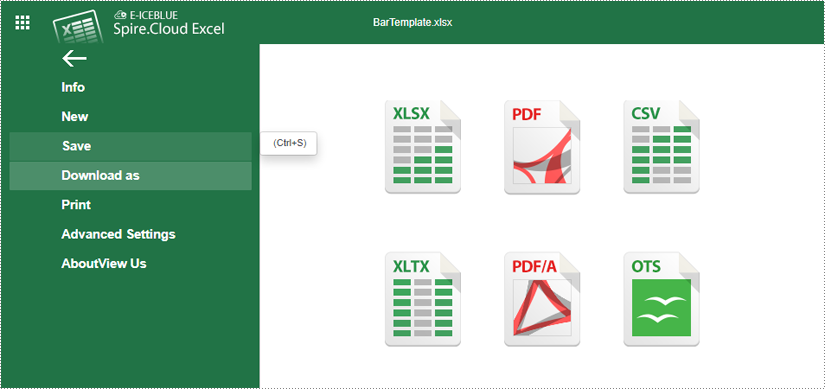
- Your file has been saved and can be accessed on the example page.