
.NET (1273)
Children categories
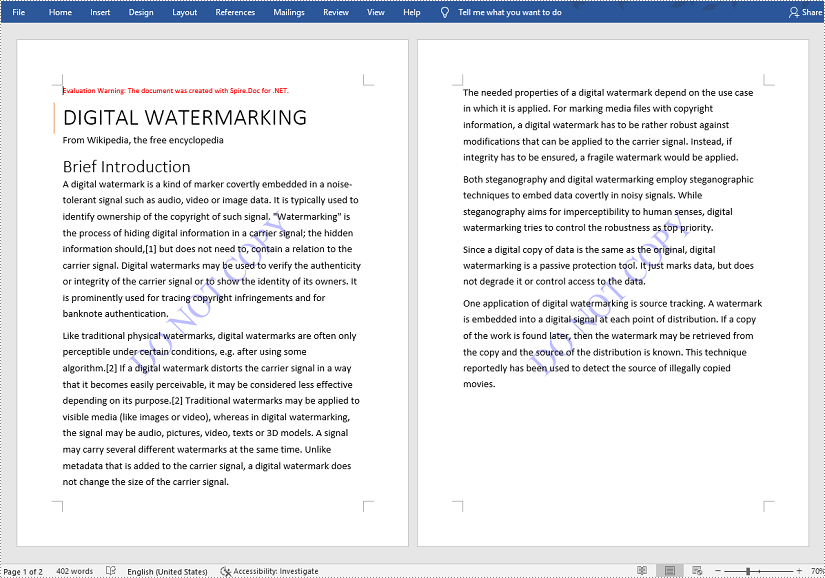
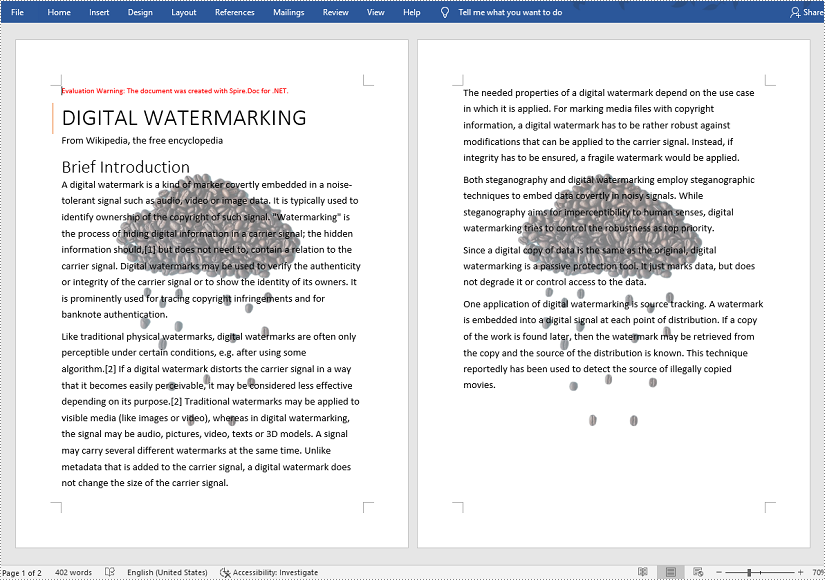
Watermarks are text or images displayed fadedly or in gray color in the background of a Word document. They can be used to declare confidentiality, copyright, or other attributes of the document, or just as decorations to make the document more attractive. This article shows an easy way to insert watermarks in Word documents with the help of Spire.Doc for .NET, including text watermarks and image watermarks.
Install Spire.Doc for .NET
To begin with, you need to add the DLL files included in the Spire.Doc for.NET package as references in your .NET project. The DLL files can be either downloaded from this link or installed via NuGet.
PM> Install-Package Spire.Doc
Insert a Text Watermark in a Word Document
The detailed steps are as follows:
- Create an object of Document class.
- Load a Word document from disk using Document.LoadFromFile() method.
- Insert a text watermark in the document using custom method InsertTextWatermark().
- Save the document using Doucment.SaveToFile() method.
- C#
- VB.NET
using System;
using System.Drawing;
using Spire.Doc;
using Spire.Doc.Documents;

namespace InsertImageWatermark
{
    internal class Program
    {
        static void Main(string[] args)
        {
            //Create an object of Document class
            Document document = new Document();

            //Load a Word document from disk
            document.LoadFromFile(@"D:\Samples\Sample.docx");

            //Insert a text watermark
            InsertTextWatermark(document.Sections[0]);

            //Save the document
            document.SaveToFile("InsertTextWatermark.docx", FileFormat.Docx);
        }
        private static void InsertTextWatermark(Section section)
        {
            TextWatermark txtWatermark = new TextWatermark();
            txtWatermark.Text = "DO NOT COPY";
            txtWatermark.FontSize = 50;
            txtWatermark.Color = Color.Blue;
            txtWatermark.Layout = WatermarkLayout.Diagonal;
            section.Document.Watermark = txtWatermark;

        }
    }
}
Insert an Image Watermark in a Word Document
The detailed steps are as follows:
- Create an object of Document class.
- Load a Word document from disk using Document.LoadFromFile() method.
- Insert an image watermark in the document using custom method InsertImageWatermark().
- Save the document using Document.SaveToFile() method.
- C#
- VB.NET
using System;
using System.Drawing;
using Spire.Doc;
using Spire.Doc.Documents;

namespace InsertWatermark
{
    internal class Program
    {
        static void Main(string[] args)
        {
            //Create an object of Document class
            Document document = new Document();

            //Load a Word document from disk
            document.LoadFromFile(@"D:\Samples\Sample.docx");

            //Insert an image watermark
            InsertImageWatermark(document);

            //Save the document
            document.SaveToFile("InsertImageWatermark.docx", FileFormat.Docx);
        }
        private static void InsertImageWatermark(Document document)
        {
            PictureWatermark picture = new PictureWatermark();
            picture.Picture = Image.FromFile(@"D:\Samples\Watermark.png");
            picture.Scaling = 200;
            picture.IsWashout = false;
            document.Watermark = picture;
        }
    }
}
Apply for a Temporary License
If you'd like to remove the evaluation message from the generated documents, or to get rid of the function limitations, please request a 30-day trial license for yourself.
It's helpful to split a single PDF into several smaller ones in certain situations. For example, you can divide large contracts, reports, books, academic papers, or other documents into smaller pieces make them easy to review or reuse. In this article, you will learn how to split PDF into single-page PDFs and how to split PDF by page ranges in C# and VB.NET by using Spire.PDF for .NET.
Install Spire.PDF for .NET
To begin with, you need to add the DLL files included in the Spire.PDF for.NET package as references in your .NET project. The DLLs files can be either downloaded from this link or installed via NuGet.
PM> Install-Package Spire.PDF
Split PDF into One-Page PDFs in C#, VB.NET
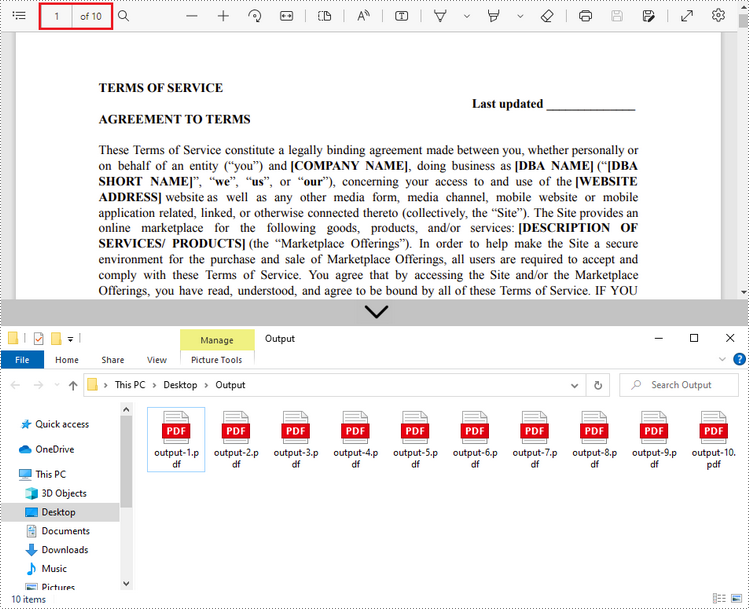
Spire.PDF offers the Split() method to divide a multi-page PDF document into multiple single-page files. The following are the detailed steps.
- Create a PdfDcoument object.
- Load a PDF document using PdfDocument.LoadFromFile() method.
- Split the document into one-page PDFs using PdfDocument.Split(string destFilePattern, int startNumber) method.
- C#
- VB.NET
using System;
using Spire.Pdf;

namespace SplitPDFIntoIndividualPages
{
    class Program
    {
        static void Main(string[] args)
        {
            //Specify the input file path
            String inputFile = "C:\\Users\\Administrator\\Desktop\\Terms of Service.pdf";

            //Specify the output directory
            String outputDirectory = "C:\\Users\\Administrator\\Desktop\\Output\\";

            //Create a PdfDocument object
            PdfDocument doc = new PdfDocument();

            //Load a PDF file
            doc.LoadFromFile(inputFile);

            //Split the PDF to one-page PDFs
            doc.Split(outputDirectory + "output-{0}.pdf", 1);
        }
    }
}
Split PDF by Page Ranges in C#, VB.NET
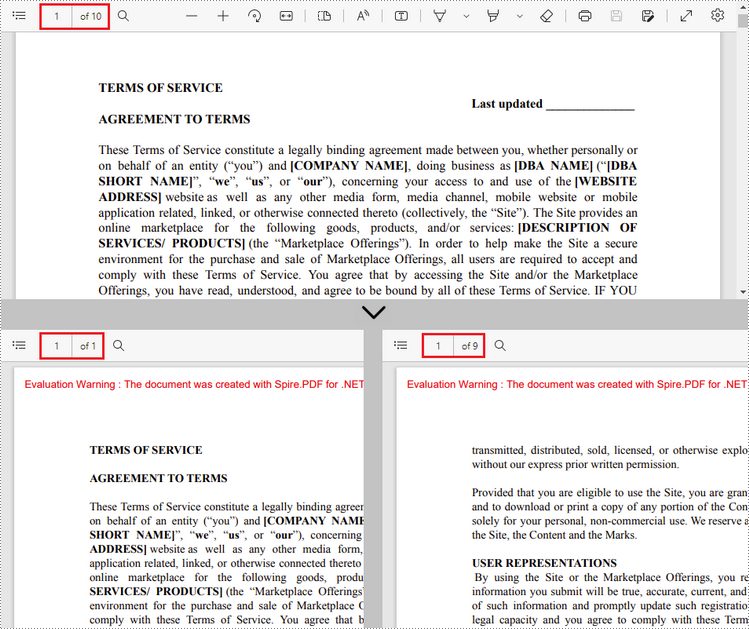
No straightforward method is offered for splitting PDF documents by page ranges. To do so, we create two or more new PDF documents and import the page or page range from the source document into them. Here are the detailed steps.
- Load the source PDF file while initialing the PdfDocument object.
- Create two additional PdfDocument objects.
- Import the first page from the source file to the first document using PdfDocument.InsertPage() method.
- Import the remaining pages from the source file to the second document using PdfDocument.InsertPageRange() method.
- Save the two documents as separate PDF files using PdfDocument.SaveToFile() method.
- C#
- VB.NET
using Spire.Pdf;
using System;

namespace SplitPdfByPageRanges
{
    class Program
    {
        static void Main(string[] args)
        {
            //Specify the input file path
            String inputFile = "C:\\Users\\Administrator\\Desktop\\Terms of Service.pdf";

            //Specify the output directory
            String outputDirectory = "C:\\Users\\Administrator\\Desktop\\Output\\";

            //Load the source PDF file while initialing the PdfDocument object
            PdfDocument sourceDoc = new PdfDocument(inputFile);

            //Create two additional PdfDocument objects
            PdfDocument newDoc_1 = new PdfDocument();
            PdfDocument newDoc_2 = new PdfDocument();

            //Insert the first page of source file to the first document
            newDoc_1.InsertPage(sourceDoc, 0);

            //Insert the rest pages of source file to the second document
            newDoc_2.InsertPageRange(sourceDoc, 1, sourceDoc.Pages.Count - 1);

            //Save the two documents as PDF files
            newDoc_1.SaveToFile(outputDirectory + "output-1.pdf");
            newDoc_2.SaveToFile(outputDirectory + "output-2.pdf");
        }
    }
}
Apply for a Temporary License
If you'd like to remove the evaluation message from the generated documents, or to get rid of the function limitations, please request a 30-day trial license for yourself.
What is Excel Interior?
Excel provides essentially no support in worksheet functions for Working with cell colors. However, colors are often used in spreadsheets to indicate some sorts of value or category. Thus comes the need for functions that can work with colors on the worksheet. So it appears in the version in Excel 2007 as a new function. It contains all kinds of colors. Below I will show you how to insert interior in Excel with MS Excel and how to do this with Spire.XLS.
How to insert interior in Excel with MS Excel?
To insert interior in Excel with Microsoft Excel, you can follow the sections below:
- Open the worksheet in Excel
- Highlight the zones that you want to insert interior
- Rightclick and choose Setting Cell Format
- Choose Fill->Fill Effect in the dialog box of Setting Cell Format
- In the box, you can change the Color and the Shade Format to your desired effect
How to Insert Interior with Spire.XLS?
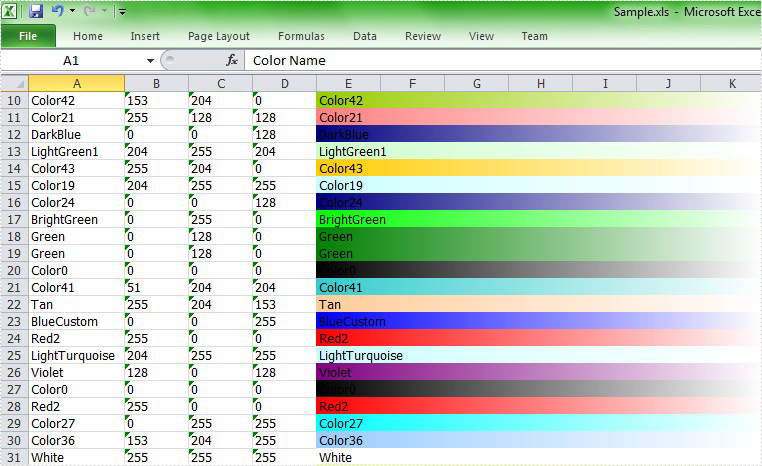
It's convenient to realize C#/.NET Excel Integration via Spire.XLS. In interior method, to realize interior you may set the color gradient by assigning sheet.Range[string.Format("E{0}:K{0}", i)].Style.Interior.FillPattern property with ExcelPatternType.Gradient. You can set the BackKnownColor and ForeKnownColor of the sheet. What's more, you can set the gradient style, in the demo, we set the gradient style vertical. In order to reflect the effect, we merge the worksheet range from E to K. In this demo, we use Enum method to enumerate many kinds of colors and define a random object to fill the cell with a gradient color randomly.
First, let's preview the effect screenshot:
Here comes to the full code in C# and VB.NET.
using Spire.Xls;
using System.Drawing;
using System;

namespace Interior
{
    class Program
    {
        static void Main(string[] args)
        {
            //Create a workbook
            Workbook workbook = new Workbook();

            //Initialize the worksheet
            Worksheet sheet = workbook.Worksheets[0];

            //Specify the version
            workbook.Version = ExcelVersion.Version2007;

            //Define the number of the colors
            int maxColor = Enum.GetValues(typeof(ExcelColors)).Length;

            //Create a random object
            Random random = new Random((int)System.DateTime.Now.Ticks);

            for (int i = 2; i < 40; i++)
            {
                //Random backKnownColor
                ExcelColors backKnownColor = (ExcelColors)(random.Next(1, maxColor / 2));
                sheet.Range["A1"].Text = "Color Name";
                sheet.Range["B1"].Text = "Red";
                sheet.Range["C1"].Text = "Green";
                sheet.Range["D1"].Text = "Blue";

                //Merge the sheet"E1-K1"
                sheet.Range["E1:K1"].Merge();
                sheet.Range["E1:K1"].Text = "Gradient";
                sheet.Range["A1:K1"].Style.Font.IsBold = true;
                sheet.Range["A1:K1"].Style.Font.Size = 11;

                //Set the text of color in sheetA-sheetD
                string colorName = backKnownColor.ToString();
                sheet.Range[string.Format("A{0}", i)].Text = colorName;
                sheet.Range[string.Format("B{0}", i)].Text = workbook.GetPaletteColor(backKnownColor).R.ToString();
                sheet.Range[string.Format("C{0}", i)].Text = workbook.GetPaletteColor(backKnownColor).G.ToString();
                sheet.Range[string.Format("D{0}", i)].Text = workbook.GetPaletteColor(backKnownColor).B.ToString();

                //Merge the sheets
                sheet.Range[string.Format("E{0}:K{0}", i)].Merge();

                //Set the text of sheetE-sheetK
                sheet.Range[string.Format("E{0}:K{0}", i)].Text = colorName;

                //Set the interior of the color
                sheet.Range[string.Format("E{0}:K{0}", i)].Style.Interior.FillPattern = ExcelPatternType.Gradient;
                sheet.Range[string.Format("E{0}:K{0}", i)].Style.Interior.Gradient.BackKnownColor = backKnownColor;
                sheet.Range[string.Format("E{0}:K{0}", i)].Style.Interior.Gradient.ForeKnownColor = ExcelColors.White;
                sheet.Range[string.Format("E{0}:K{0}", i)].Style.Interior.Gradient.GradientStyle = GradientStyleType.Vertical;
                sheet.Range[string.Format("E{0}:K{0}", i)].Style.Interior.Gradient.GradientVariant = GradientVariantsType.ShadingVariants1;
            }

            //AutoFit Column
            sheet.AutoFitColumn(1);

            //Save the file
            workbook.SaveToFile("Sample.xls",ExcelVersion.Version97to2003);

            //Launch the file
            System.Diagnostics.Process.Start("Sample.xls");
        }
    }
}
Imports Spire.Xls
Imports System.Drawing
Imports System

Module Module1

    Sub Main()
        'Create a workbook
        Dim workbook As New Workbook()

        'Initialize the worksheet
        Dim sheet As Worksheet = workbook.Worksheets(0)

        'Specify the version
        workbook.Version = ExcelVersion.Version2007

        'Define the number of the colors
        Dim maxColor As Integer = [Enum].GetValues(GetType(ExcelColors)).Length

        'Create a random object
        Dim random As New Random()

        For i As Integer = 2 To 39
            'Random backKnownColor
            Dim backKnownColor As ExcelColors = DirectCast(random.[Next](1, maxColor \ 2), ExcelColors)
            sheet.Range("A1").Text = "Color Name"
            sheet.Range("B1").Text = "Red"
            sheet.Range("C1").Text = "Green"
            sheet.Range("D1").Text = "Blue"

            'Merge the sheet"E1-K1"
            sheet.Range("E1:K1").Merge()
            sheet.Range("E1:K1").Text = "Gradient"
            sheet.Range("A1:K1").Style.Font.IsBold = True
            sheet.Range("A1:K1").Style.Font.Size = 11

            'Set the text of color in sheetA-sheetD
            Dim colorName As String = backKnownColor.ToString()
            sheet.Range(String.Format("A{0}", i)).Text = colorName
            sheet.Range(String.Format("B{0}", i)).Text = workbook.GetPaletteColor(backKnownColor).R.ToString()
            sheet.Range(String.Format("C{0}", i)).Text = workbook.GetPaletteColor(backKnownColor).G.ToString()
            sheet.Range(String.Format("D{0}", i)).Text = workbook.GetPaletteColor(backKnownColor).B.ToString()

            'Merge the sheets
            sheet.Range(String.Format("E{0}:K{0}", i)).Merge()

            'Set the text of sheetE-sheetK
            sheet.Range(String.Format("E{0}:K{0}", i)).Text = colorName

            'Set the interior of the color
            sheet.Range(String.Format("E{0}:K{0}", i)).Style.Interior.FillPattern = ExcelPatternType.Gradient
            sheet.Range(String.Format("E{0}:K{0}", i)).Style.Interior.Gradient.BackKnownColor = backKnownColor
            sheet.Range(String.Format("E{0}:K{0}", i)).Style.Interior.Gradient.ForeKnownColor = ExcelColors.White
            sheet.Range(String.Format("E{0}:K{0}", i)).Style.Interior.Gradient.GradientStyle = GradientStyleType.Vertical
            sheet.Range(String.Format("E{0}:K{0}", i)).Style.Interior.Gradient.GradientVariant = GradientVariantsType.ShadingVariants1
        Next

        'AutoFit Column
        sheet.AutoFitColumn(1)

        'Save doc file.
        workbook.SaveToFile("Sample.xls",ExcelVersion.Version97to2003)

        'Launching the MS Word file.
        System.Diagnostics.Process.Start("Sample.xls")
    End Sub
End Module
After running the demo, you will find color interior in your 2007 worksheet.
It is necessary to edit existing Excel workbook when the data information has changed. For example, if the one staff’s telephone number or address is changed, the matched data in Excel should be changed as well. Solution in this guide focuses on introducing the solution to Edit Excel and format edited data in C# and VB.NET. The following screenshot presents result after editing.
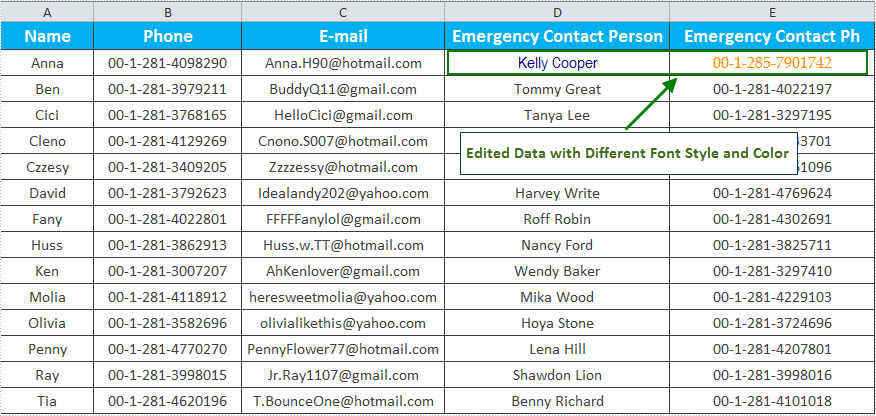
Spire.XLS for .NET, a professional .NET Excel component, provides an XlsRange class to enables users to set Text, Value, Number, Formula or other properties to edit data in specified cells. In this example, the data in Cell D2 and E2 is edited in the existing Excel workbook. Also, the edited data will be formatted for distinguishing with other data information. When formatting, set Font properties of CellStyle for specified cell range, including FontName and Color. Download and Install Spire.XLS for .NET and follow code below.
using Spire.Xls;
using System.Drawing;

namespace EditSheet
{
    class Program
    {
        static void Main(string[] args)
        {
            //Load Workbook
            Workbook workbook = new Workbook();
            workbook.LoadFromFile(@"E:\Work\Documents\ExcelFiles\Staff Contact Info.xlsx");

            //Edit Text
            Worksheet sheet = workbook.Worksheets[0];
            sheet.Range["D2"].Text = "Kelly Cooper";
            sheet.Range["D2"].Style.Font.FontName = "Arial Narrow";
            sheet.Range["D2"].Style.Font.Color = Color.DarkBlue;

            //Edit Cell Value
            sheet.Range["E2"].Value = "00-1-285-7901742";
            sheet.Range["E2"].Style.Font.FontName = "Book Antiqua";
            sheet.Range["E2"].Style.Font.Color = Color.DarkOrange;

            //Save and Launch
            workbook.SaveToFile("EditSheet.xlsx", ExcelVersion.Version2010);
            System.Diagnostics.Process.Start("EditSheet.xlsx");

        }
    }
}
Imports Spire.Xls
Imports System.Drawing

Namespace EditSheet
    Friend Class Program
        Shared Sub Main(ByVal args() As String)
            'Load Workbook
            Dim workbook As New Workbook()
            workbook.LoadFromFile("E:\Work\Documents\ExcelFiles\Staff Contact Info.xlsx")

            'Edit Text
            Dim sheet As Worksheet = workbook.Worksheets(0)
            sheet.Range("D2").Text = "Kelly Cooper"
            sheet.Range("D2").Style.Font.FontName = "Arial Narrow"
            sheet.Range("D2").Style.Font.Color = Color.DarkBlue

            'Edit Cell Value
            sheet.Range("E2").Value = "00-1-285-7901742"
            sheet.Range("E2").Style.Font.FontName = "Book Antiqua"
            sheet.Range("E2").Style.Font.Color = Color.DarkOrange

            'Save and Launch
            workbook.SaveToFile("EditSheet.xlsx", ExcelVersion.Version2010)
            System.Diagnostics.Process.Start("EditSheet.xlsx")

        End Sub
    End Class
End Namespace
This section aims at providing developers a solution to unlock sheet in Excel workbook with C#, VB.NET via this Excel library Spire.XLS for .NET.
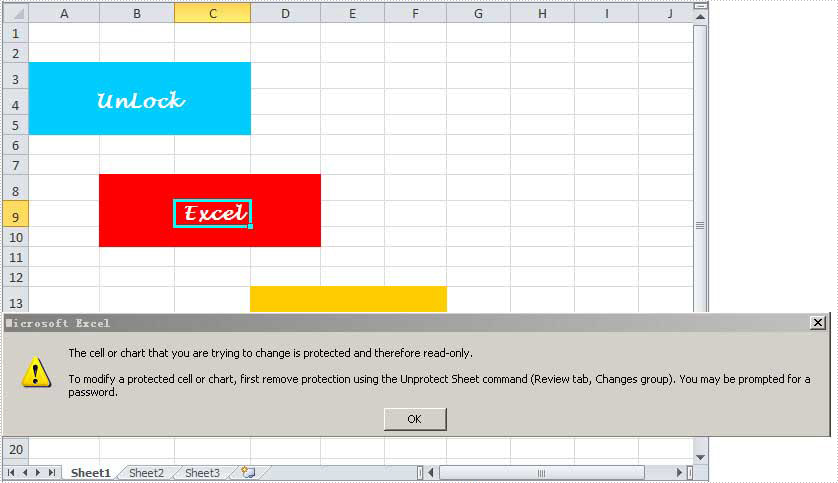
Spire.XLS for .NET enables you to unlock any sheet in Excel file only by one line of key code: Spire.Xls.Worksheet.Unprotect(string password); Besides, as an MS Excel component, Spire.XLS for .NET also enables you to create, read and handle Excel files with fast speed. Below is an Excel file with protected worksheets which will be unlocked in my task.
Since you will use Spire.XLS for .NET, you have to download Spire.XLS for .NET and install it on system. When you create your project, please do not forget to add Spire.XLS.dll as reference from Bin folder. The default path is "..\Spire.XLS\Bin\NET4.0\Spire.XLS.dll". Please note that Spire.XLS for .NET supports .NET Framework 2.0 and above. Here is the whole code for unlocking Excel sheet:
namespace UnlockExcelSheet
{
    class Program
    {
        static void Main(string[] args)
        {
            //initialize an instance of Workbook
            Workbook workbook = new Workbook();
            //Load an Excel file with protected worksheet
            workbook.LoadFromFile(@"..\Unlock Excel Worksheet.xlsx");
            //get the first worksheet
            Worksheet sheet = workbook.Worksheets[0];
            //Unprotect worksheet
            sheet.Unprotect("iceblue");
            //Save the file
            workbook.SaveToFile("Sample.xlsx",ExcelVersion.Version2010);
            //Launch the file
            System.Diagnostics.Process.Start("Sample.xlsx");
        }
    }
}
Namespace UnlockExcelSheet
	Class Program
		Private Shared Sub Main(args As String())
			'initialize an instance of Workbook
			Dim workbook As New Workbook()
			'Load an Excel file with protected worksheet
			workbook.LoadFromFile("..\Unlock Excel Worksheet.xlsx")
			'get the first worksheet
			Dim sheet As Worksheet = workbook.Worksheets(0)
			'Unprotect worksheet
			sheet.Unprotect("iceblue")
			'Save the file
			workbook.SaveToFile("Sample.xlsx",ExcelVersion.Version2010)
			'Launch the file
			System.Diagnostics.Process.Start("Sample.xlsx")
		End Sub
	End Class
End Namespace
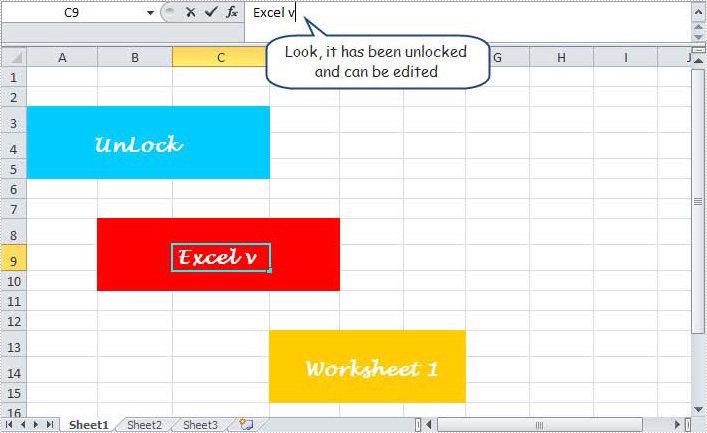
After executing above code, you can see that the protected worksheet in the original Excel file has been unlocked, we can edit it also. Please see following image.
In this section, I have introduced the solution to unlock any sheet in Excel file via Spire.XLS for .NET. I hope it can help you. If you have any questions, feedbacks and advice, you can put them on E-iceblue Forum. We will promise a prompt reply.
By running VBA within the Office applications, developers/programmers can build customized solutions and programs to enhance the capabilities of those applications. The VBA function of Excel is very powerful. Below I will show you how to use VBA by Spire.XLS.
VBA is the acronym for VB.NET for Applications. It is an implementation of Microsoft's event-driven programming language VB.NET 6 and its associated integrated development environment (IDE), which are built into most Microsoft Office applications. VBA is closely related to VB.NET and uses the VB.NET Runtime Library, but can normally only run code within a host application rather than as a standalone program. It can be used to control one application from another via OLE Automation.
Spire.XLS for .NET is a professional Excel .NET component that can be linked into any type of .NET 2.0, 3.5 or 4.0 projects, either ASP.NET web sites or Windows Forms application. Spire.XLS for .NET offers a combination of APIs and GUI controls for speeding up Excel programming in .NET platform-create new Excel documents from scratch, edit existing Excel documents and convert Excel files. At the same time, Spire.XLS supports VBA and it can load/Save Excel VBA.
Here comes to the steps:
- Write a template with VBA program with which you can execute your work in Excel.
- Create another workbook to load the VBA template.
In this demo, it generates a new worksheet named "test" with the VBA template we provide.
Please check the codes as below:
using Spire.Xls;

namespace NumberFormat
{
    class Program
    {
        static void Main(string[] args)
        {
            //Create a workbook
            Workbook workbook = new Workbook();

            //Initailize worksheet
            workbook.LoadFromFile("VBASample.xls");
            Worksheet sheet = workbook.Worksheets[0];

            //VBA function
            sheet.Range["A1"].Text = "test";

            //Save the file
            workbook.SaveToFile("Sample.xls",ExcelVersion.Version97to2003);

            //Launch the file
            System.Diagnostics.Process.Start("Sample.xls");
        }
    }
}
Imports Spire.Xls

Module Module1

    Sub Main()
        'Create a workbook
        Dim workbook As New Workbook()

        'Initailize worksheet
        workbook.LoadFromFile("VBASample.xls")
        Dim sheet As Worksheet = workbook.Worksheets(0)

        'VBA function
        sheet.Range("A1").Text = "test"

        'Save doc file.
        workbook.SaveToFile("Sample.xls",ExcelVersion.Version97to2003)

        'Launching the MS Word file.
        System.Diagnostics.Process.Start("Sample.xls")
    End Sub
End Module
In C# applications, efficiently converting data between Excel files and DataTables is essential for enhancing data accessibility, analysis, and processing capabilities. By transferring data from Excel to DataTables, developers can leverage the full power of .NET to analyze, transform, and process data, while converting data back to Excel enables easy sharing, reporting, and integration with other systems. This article demonstrates how to use Spire.XLS for .NET to export data from Excel files DataTable and import Data from Datable to Excel files with C# code.
Install Spire.XLS for .NET
To begin with, you need to add the DLL files included in the Spire.XLS for .NET package as references in your .NET project. The DLL files can be either downloaded from this link or installed via NuGet.
PM> Install-Package Spire.XLS
Export Data from Excel to DataTable with C#
Spire.XLS for .NET offers the Worksheet.ExportDataTable() method to export data from an entire Excel worksheet to a DataTable object. Additionally, the Worksheet.Range[].ExportDataTable() method allows exporting from a specific cell range to a DataTable. Developers can use the ExportTableOptions class to customize options when exporting data from a cell range. The detailed steps for the exporting are as follows:
- Create an instance of the Workbook class and load an Excel file using the Workbook.LoadFromFile() method.
- Access a worksheet in the Excel file via the Workbook.Worksheets[] property.
- Export the data from the entire worksheet to a DataTable object using the Worksheet.ExportDataTable() method.
- Alternatively:
- Create an instance of ExportTableOptions to specify export options.
- Export data from a specified cell range to a DataTable using the Worksheet.ExportDataTable() method with the ExportTableOptions instance as a parameter.
- Output the DataTable.
- C#
using Spire.Xls;
using System.Data;

namespace ExcelToDataTable
{
    class Program
    {
        static void Main(string[] args)
        {
            // Create an instance of Workbook
            Workbook wb = new Workbook();

            // Load the Excel file
            wb.LoadFromFile("Sample.xlsx");

            // Get a worksheet
            Worksheet sheet = wb.Worksheets[0];

            // Export worksheet data to DataTable
            //DataTable dataTable = sheet.ExportDataTable();

            // Or export a specified cell range to DataTable
            ExportTableOptions options = new ExportTableOptions();
            options.ComputedFormulaValue = true;
            options.ExportColumnNames = false;
            options.KeepDataFormat = false;
            options.RenameStrategy = RenameStrategy.Letter;
            DataTable dataTable = sheet.Range[5, 1, 7, 6].ExportDataTable(options);

            // Output the column names of the DataTable
            for (int i = 0; i < dataTable.Columns.Count; i++)
            {
                Console.Write(dataTable.Columns[i].ColumnName + "\t");
            }
            Console.WriteLine();

            // Output the data rows of the DataTable
            foreach (DataRow row in dataTable.Rows)
            {
                foreach (var item in row.ItemArray)
                {
                    Console.Write(item + "\t");
                }
                Console.WriteLine();
            }
        }
    }
}
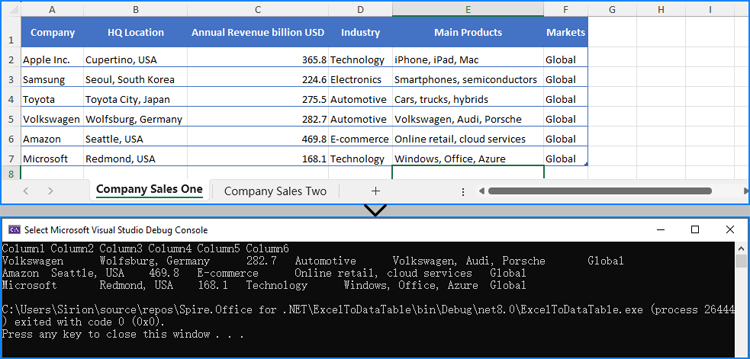
Import Data from DataTable to Excel with C#
Spire.XLS for .NET provides the Worksheet.InsertDataTable(DataTable, colHeaders: bool, firstRow: int, firstColumn: int) method to insert data from a DataTable object into an Excel worksheet. The detailed steps for importing data from a DataTable to Excel are as follows:
- Define the data and create a DataTable object.
- Create a Workbook instance and clear the default worksheets using the Workbook.Worksheets.Clear() method.
- Insert a new worksheet with a specified name using the Workbook.Worksheets.Add(sheetName: string) method.
- Insert the data from the DataTable object to the worksheet using Worksheet.InsertDataTable() method.
- Adjust the formatting as needed.
- Save the workbook using the Workbook.SaveToFile() method.
- C#
using Spire.Xls;
using System.Data;

namespace DataTableToExcel
{
    class Program
    {
        static void Main(string[] args)
        {
            // Define a dataset and create an instance of DataTable
            // Redefine data array with new products and quantities
            string[,] data = new string[,]
            {
                { "Product", "Quantity", "SalesAmount" },
                { "Product X", "75", "4500.0" },
                { "Product Y", "200", "12000.0" },
                { "Product Z", "90", "5400.0" },
                { "Product W", "150", "9000.0" },
                { "Product Q", "130", "7800.0" },
                { "Product R", "85", "5100.0" },
                { "Product S", "160", "9600.0" }
            };
            DataTable dataTable = new DataTable();

            // Get the number of columns
            int columnCount = data.GetLength(1);

            // Add columns to DataTable
            for (int col = 0; col < columnCount; col++)
            {
                dataTable.Columns.Add(data[0, col]);
            }

            // Add rows to DataTable
            for (int row = 1; row < data.GetLength(0); row++)
            {
                DataRow dataRow = dataTable.NewRow();
                for (int col = 0; col < columnCount; col++)
                {
                    dataRow[col] = data[row, col];
                }
                dataTable.Rows.Add(dataRow);
            }

            // Create an instance of Workbook
            Workbook workbook = new Workbook();

            // Clear default worksheets and add a new worksheet
            workbook.Worksheets.Clear();
            Worksheet sheet = workbook.Worksheets.Add("SalesReport");

            // Import DataTable data into the worksheet
            sheet.InsertDataTable(dataTable, true, 1, 1);

            // Adjust column widths for better readability
            for (int i = 1; i <= sheet.AllocatedRange.ColumnCount; i++)
            {
                sheet.AutoFitColumn(i);
            }

            // Save the workbook to a file
            workbook.SaveToFile("output/DataTableToExcel.xlsx", FileFormat.Version2016);
            workbook.Dispose();
        }
    }
}
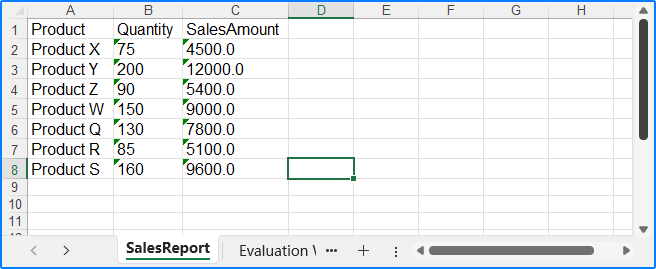
Apply for a Temporary License
If you'd like to remove the evaluation message from the generated documents, or to get rid of the function limitations, please request a 30-day trial license for yourself.
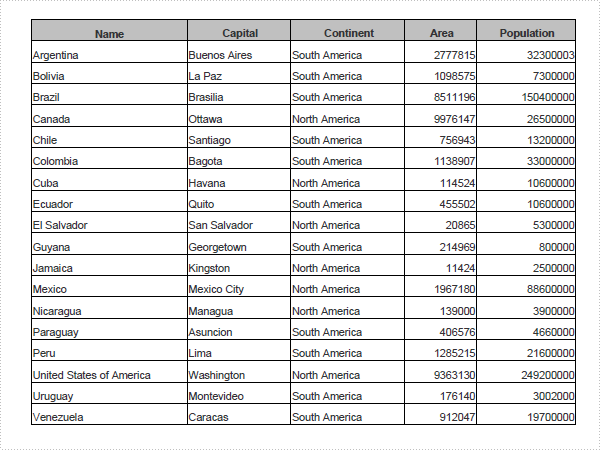
The sample demonstrates how to convert Excel workbook to PDF file via Spire.XLS.
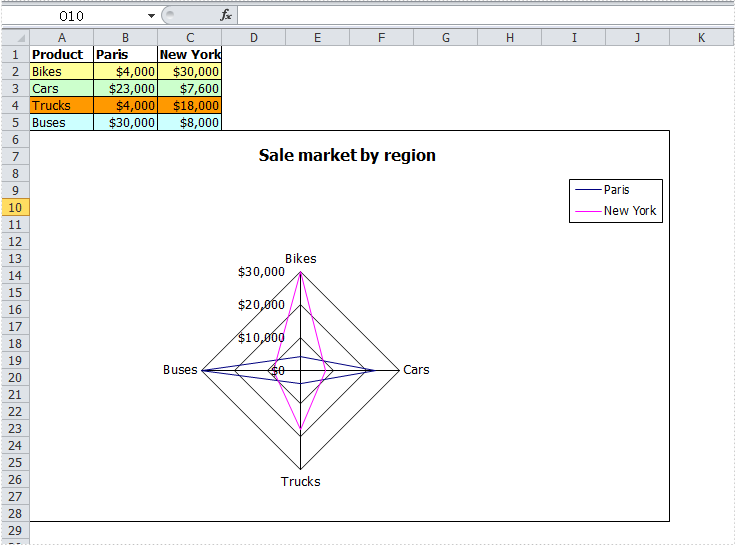
Radar chart is one kind of excel charts. It is also known as spider chart, star chart, cobweb chart, web chart, star plot, irregular polygon, polar chart, or kiviat diagram which is a graphical method of displaying multivariate data in the form of a two-dimensional chart of three or more quantitative variables represented on axes starting from the same point.
Radar chart is very useful to display multivariate observations with an arbitrary number of variables. Each star represents a single observation. Typically, radar charts are generated in a multi-plot format with many stars on each page and each star represents one observation.
How to Use C# Create Excel Radar Chart
Spire.XLS allows user to create kinds of charts in Excel including Radar Chart. It is easy to create Excel Radar chart with C# via Spire.XLS as in MS Excel. The whole process is almost the same such as write chart data, set region/position of chart, Write chart title, chart data information, etc. The difference is we need fill these data in C# application with codes around. The following is a sample for C# code used to create Excel Radar charts. Download Spire.XLS (or Spire.Office) with .NET framework 2.0 (or above) together and use the code to create Excel Radar Chart right now.
		private void btnRun_Click(object sender, System.EventArgs e)
		{
			Workbook workbook = new Workbook();

			//Initailize worksheet
			workbook.CreateEmptySheets(1);
			Worksheet sheet = workbook.Worksheets[0];
			sheet.Name = "Chart data";
			sheet.GridLinesVisible = false;

			//Writes chart data
			CreateChartData(sheet);
            //Add a new  chart worsheet to workbook
			Chart chart = sheet.Charts.Add();

			//Set position of chart
			chart.LeftColumn = 1;
			chart.TopRow = 6;
			chart.RightColumn = 11;
			chart.BottomRow = 29;

			//Set region of chart data
			chart.DataRange = sheet.Range["A1:C5"];
			chart.SeriesDataFromRange = false;

			if (checkBox1.Checked)
			{
				chart.ChartType =  ExcelChartType.RadarMarkers;
			}
			else
			{
				chart.ChartType = ExcelChartType.Radar;
			}

            //Chart title
			chart.ChartTitle = "Sale market by region";
			chart.ChartTitleArea.IsBold = true;
			chart.ChartTitleArea.Size = 12;

			chart.PlotArea.Fill.Visible = false;

			chart.Legend.Position = LegendPositionType.Corner;
			workbook.SaveToFile("Sample.xls",ExcelVersion.Version97to2003);
			ExcelDocViewer(workbook.FileName);
		}

		private void CreateChartData(Worksheet sheet)
		{
			//Product
			sheet.Range["A1"].Value = "Product";
			sheet.Range["A2"].Value = "Bikes";
			sheet.Range["A3"].Value = "Cars";
			sheet.Range["A4"].Value = "Trucks";
			sheet.Range["A5"].Value = "Buses";

			//Paris
			sheet.Range["B1"].Value = "Paris";
			sheet.Range["B2"].NumberValue = 4000;
			sheet.Range["B3"].NumberValue = 23000;
			sheet.Range["B4"].NumberValue = 4000;
			sheet.Range["B5"].NumberValue = 30000;

			//New York
			sheet.Range["C1"].Value = "New York";
			sheet.Range["C2"].NumberValue = 30000;
			sheet.Range["C3"].NumberValue = 7600;
			sheet.Range["C4"].NumberValue = 18000;
			sheet.Range["C5"].NumberValue = 8000;

			//Style
			sheet.Range["A1:C1"].Style.Font.IsBold = true;
			sheet.Range["A2:C2"].Style.KnownColor = ExcelColors.LightYellow;
			sheet.Range["A3:C3"].Style.KnownColor = ExcelColors.LightGreen1;
			sheet.Range["A4:C4"].Style.KnownColor = ExcelColors.LightOrange;
			sheet.Range["A5:C5"].Style.KnownColor = ExcelColors.LightTurquoise;

			//Border
			sheet.Range["A1:C5"].Style.Borders[BordersLineType.EdgeTop].Color = Color.FromArgb(0, 0, 128);
			sheet.Range["A1:C5"].Style.Borders[BordersLineType.EdgeTop].LineStyle = LineStyleType.Thin;
			sheet.Range["A1:C5"].Style.Borders[BordersLineType.EdgeBottom].Color = Color.FromArgb(0, 0, 128);
			sheet.Range["A1:C5"].Style.Borders[BordersLineType.EdgeBottom].LineStyle = LineStyleType.Thin;
			sheet.Range["A1:C5"].Style.Borders[BordersLineType.EdgeLeft].Color = Color.FromArgb(0, 0, 128);
			sheet.Range["A1:C5"].Style.Borders[BordersLineType.EdgeLeft].LineStyle = LineStyleType.Thin;
			sheet.Range["A1:C5"].Style.Borders[BordersLineType.EdgeRight].Color = Color.FromArgb(0, 0, 128);
			sheet.Range["A1:C5"].Style.Borders[BordersLineType.EdgeRight].LineStyle = LineStyleType.Thin;

			sheet.Range["B2:C5"].Style.NumberFormat = "\"$\"#,##0";
		}
After running your application with the code above, you will find an Excel Radar Chart created.
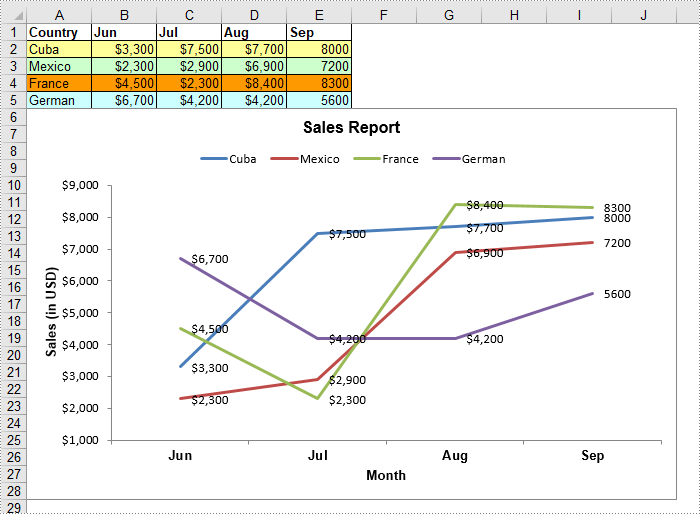
A line chart, also known as a line graph, is a type of chart that displays information as a series of data points connected by straight line segments. It is generally used to show the changes of information over a period of time, such as years, months or days. In this article, you will learn how to create a line chart in Excel in C# and VB.NET using Spire.XLS for .NET.
Install Spire.XLS for .NET
To begin with, you need to add the DLL files included in the Spire.XLS for .NET package as references in your .NET project. The DLL files can be either downloaded from this link or installed via NuGet.
PM> Install-Package Spire.XLS
Create a Line Chart in Excel using C# and VB.NET
The following are the main steps to create a line chart:
- Create an instance of Workbook class.
- Get the first worksheet by its index (zero-based) though Workbook.Worksheets[sheetIndex] property.
- Add some data to the worksheet.
- Add a line chart to the worksheet using Worksheet.Charts.Add(ExcelChartType.Line) method.
- Set data range for the chart through Chart.DataRange property.
- Set position, title, category axis title and value axis title for the chart.
- Loop through the data series of the chart, show data labels for the data points of each data series by setting the ChartSerie.DataPoints.DefaultDataPoint.DataLabels.HasValue property as true.
- Set the position of chart legend through Chart.Legend.Position property.
- Save the result file using Workbook.SaveToFile() method.
- C#
- VB.NET
using Spire.Xls;
using Spire.Xls.Charts;
using System.Drawing;

namespace CreateLineChart
{
    class Program
    {
        static void Main(string[] args)
        {
            //Create a Workbook instance
            Workbook workbook = new Workbook();

            //Get the first worksheet
            Worksheet sheet = workbook.Worksheets[0];
            //Set sheet name
            sheet.Name = "Line Chart";
            //Hide gridlines
            sheet.GridLinesVisible = false;

            //Add some data to the the worksheet
            sheet.Range["A1"].Value = "Country";
            sheet.Range["A2"].Value = "Cuba";
            sheet.Range["A3"].Value = "Mexico";
            sheet.Range["A4"].Value = "France";
            sheet.Range["A5"].Value = "German";

            sheet.Range["B1"].Value = "Jun";
            sheet.Range["B2"].NumberValue = 3300;
            sheet.Range["B3"].NumberValue = 2300;
            sheet.Range["B4"].NumberValue = 4500;
            sheet.Range["B5"].NumberValue = 6700;

            sheet.Range["C1"].Value = "Jul";
            sheet.Range["C2"].NumberValue = 7500;
            sheet.Range["C3"].NumberValue = 2900;
            sheet.Range["C4"].NumberValue = 2300;
            sheet.Range["C5"].NumberValue = 4200;

            sheet.Range["D1"].Value = "Aug";
            sheet.Range["D2"].NumberValue = 7700;
            sheet.Range["D3"].NumberValue = 6900;
            sheet.Range["D4"].NumberValue = 8400;
            sheet.Range["D5"].NumberValue = 4200;

            sheet.Range["E1"].Value = "Sep";
            sheet.Range["E2"].NumberValue = 8000;
            sheet.Range["E3"].NumberValue = 7200;
            sheet.Range["E4"].NumberValue = 8300;
            sheet.Range["E5"].NumberValue = 5600;

            //Set font and fill color for specified cells
            sheet.Range["A1:E1"].Style.Font.IsBold = true;
            sheet.Range["A2:E2"].Style.KnownColor = ExcelColors.LightYellow;
            sheet.Range["A3:E3"].Style.KnownColor = ExcelColors.LightGreen1;
            sheet.Range["A4:E4"].Style.KnownColor = ExcelColors.LightOrange;
            sheet.Range["A5:E5"].Style.KnownColor = ExcelColors.LightTurquoise;

            //Set cell borders
            sheet.Range["A1:E5"].Style.Borders[BordersLineType.EdgeTop].Color = Color.FromArgb(0, 0, 128);
            sheet.Range["A1:E5"].Style.Borders[BordersLineType.EdgeTop].LineStyle = LineStyleType.Thin;
            sheet.Range["A1:E5"].Style.Borders[BordersLineType.EdgeBottom].Color = Color.FromArgb(0, 0, 128);
            sheet.Range["A1:E5"].Style.Borders[BordersLineType.EdgeBottom].LineStyle = LineStyleType.Thin;
            sheet.Range["A1:E5"].Style.Borders[BordersLineType.EdgeLeft].Color = Color.FromArgb(0, 0, 128);
            sheet.Range["A1:E5"].Style.Borders[BordersLineType.EdgeLeft].LineStyle = LineStyleType.Thin;
            sheet.Range["A1:E5"].Style.Borders[BordersLineType.EdgeRight].Color = Color.FromArgb(0, 0, 128);
            sheet.Range["A1:E5"].Style.Borders[BordersLineType.EdgeRight].LineStyle = LineStyleType.Thin;

            //Set number format
            sheet.Range["B2:D5"].Style.NumberFormat = "\"$\"#,##0";

            //Add a line chart to the worksheet
            Chart chart = sheet.Charts.Add(ExcelChartType.Line);

            //Set data range for the chart
            chart.DataRange = sheet.Range["A1:E5"];

            //Set position of the chart
            chart.LeftColumn = 1;
            chart.TopRow = 6;
            chart.RightColumn = 11;
            chart.BottomRow = 29;

            //Set and format chart title
            chart.ChartTitle = "Sales Report";
            chart.ChartTitleArea.IsBold = true;
            chart.ChartTitleArea.Size = 12;

            //Set and format category axis title
            chart.PrimaryCategoryAxis.Title = "Month";
            chart.PrimaryCategoryAxis.Font.IsBold = true;
            chart.PrimaryCategoryAxis.TitleArea.IsBold = true;

            //Set and format value axis title
            chart.PrimaryValueAxis.Title = "Sales (in USD)";
            chart.PrimaryValueAxis.HasMajorGridLines = false;
            chart.PrimaryValueAxis.TitleArea.TextRotationAngle = -90;
            chart.PrimaryValueAxis.MinValue = 1000;
            chart.PrimaryValueAxis.TitleArea.IsBold = true;

            //Loop through the data series of the chart
            foreach (ChartSerie cs in chart.Series)
            {
                cs.Format.Options.IsVaryColor = true;
                //Show data labels for data points
                cs.DataPoints.DefaultDataPoint.DataLabels.HasValue = true;
            }

            //Set position of chart legend
            chart.Legend.Position = LegendPositionType.Top;

            //Save the result file
            workbook.SaveToFile("LineChart.xlsx", ExcelVersion.Version2016);
        }
    }
}
Apply for a Temporary License
If you'd like to remove the evaluation message from the generated documents, or to get rid of the function limitations, please request a 30-day trial license for yourself.
