C# Scale the size of bubble chart on the presentation slides
We have already shown how to use Spire.Presentation to create the bubble chart in C# on the PowerPoint document. This article will demonstrate how to scale the size of bubble chart on the presentation slides in C#. We will use a 3-D bubble chart for example.
Step 1: Create a Presentation instance and load a sample document from the file.
Presentation ppt = new Presentation();
ppt.LoadFromFile("Sample.pptx", FileFormat.Pptx2010);
Step 2: Get the chart from the first presentation slide.
IChart chart = ppt.Slides[0].Shapes[0] as IChart;
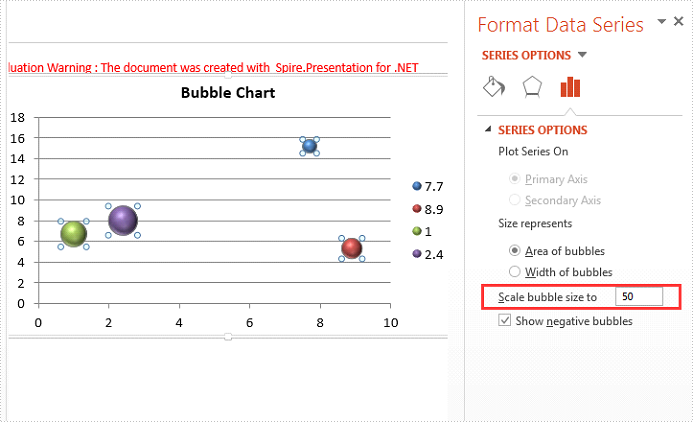
Step 3: Scale the bubble size, the range value is from 0 to 300.
chart.BubbleScale = 50;
Step 4: Save the document to file.
ppt.SaveToFile("Scalesize.pptx", FileFormat.Pptx2010);
Effective screenshot of scale the bubble size:
Full codes:
using Spire.Presentation;
using Spire.Presentation.Charts;

namespace ScaleSize
{
    class Program
    {
        static void Main(string[] args)
        {
            Presentation ppt = new Presentation();
            ppt.LoadFromFile("Sample.pptx", FileFormat.Pptx2010);
            IChart chart = ppt.Slides[0].Shapes[0] as IChart;
            chart.BubbleScale = 50;
            ppt.SaveToFile("Scalesize.pptx", FileFormat.Pptx2010);
        }
    }
}
How to explode a pie chart on a presentation slide in C#
When we work with the pie chart on the presentation slide, we may need to separate each part of pie chart to make them stand out. This article is going to introduce the method of how to set the pie explosion for the pie chart on the presentation slides in C# by using Spire.Presentation.
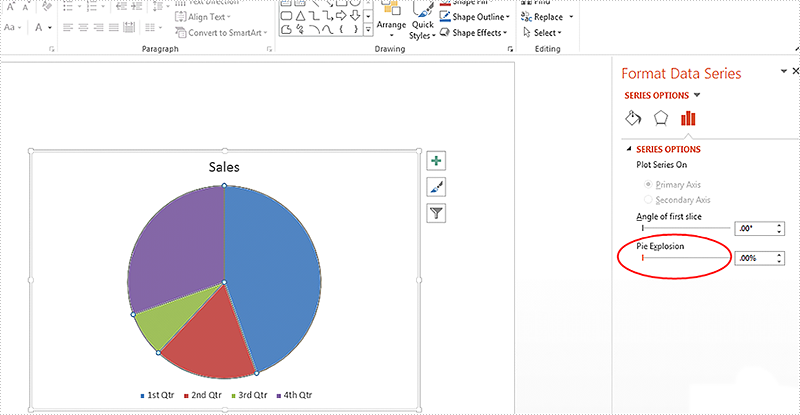
Spire.Presentation offers a property of chart.Series[].Distance to enable developers to pull the whole pie apart by exploding the pie chart.
On Microsoft PowerPoint, We can adjust the percentage of "Pie Explosion" on the Series Options at the "Format Data Series" area to control the distance between each section in the chart.
Step 1: Create a presentation document and load the file from disk.
Presentation ppt = new Presentation();
ppt.LoadFromFile("Sample.pptx");
Step 2: Get the chart that needs to set the point explosion.
IChart chart = ppt.Slides[0].Shapes[0] as IChart;
Step 3: Explode the pie chart.
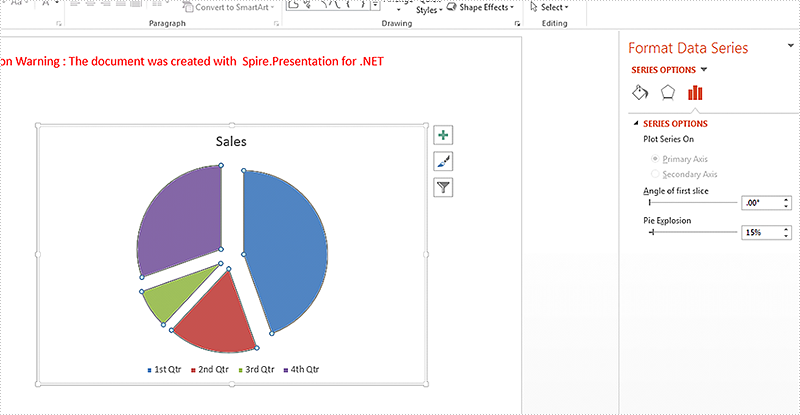
chart.Series[0].Distance = 15;
Step 4: Save the document to file.
ppt.SaveToFile("Result.pptx", FileFormat.Pptx2010);
Effective screenshots after exploding the pie chart on presentation slide:
Full codes:
using Spire.Presentation;
using Spire.Presentation.Charts;

namespace ExplodePie
{
    class Program
    {
        static void Main(string[] args)
        {
            Presentation ppt = new Presentation();
            ppt.LoadFromFile("Sample.pptx");

            IChart chart = ppt.Slides[0].Shapes[0] as IChart;

            chart.Series[0].Distance = 15;

            ppt.SaveToFile("Result.pptx", FileFormat.Pptx2010);
        }
    }
}
How to Create Chart Using Excel Data in PowerPoint in C#, VB.NET
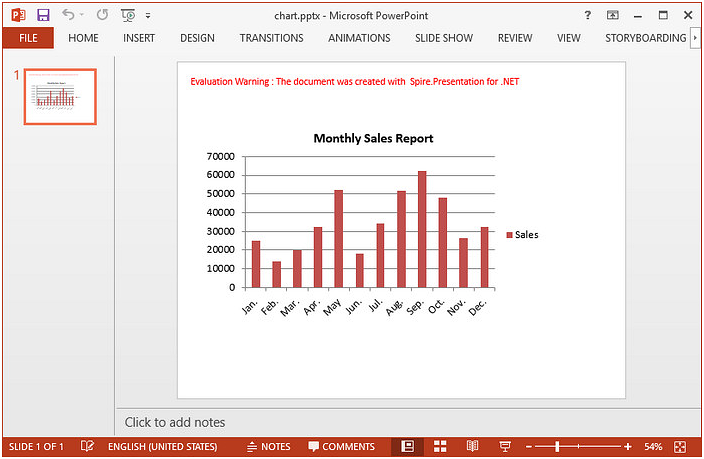
When creating charts from scratch in PowerPoint slide, an Excel sheet with some dummy data will automatically be generated. The dummy data can be overwritten with the data from data source as well as from an existing Excel file. This article demonstrates how we can create chart in PowerPoint using the data in Excel file.
This solution requires Spire.Presneation.dll and Spire.Xls.dll to be added as references in project. Please download Spire.Office and reference the corresponding DLLs from it.
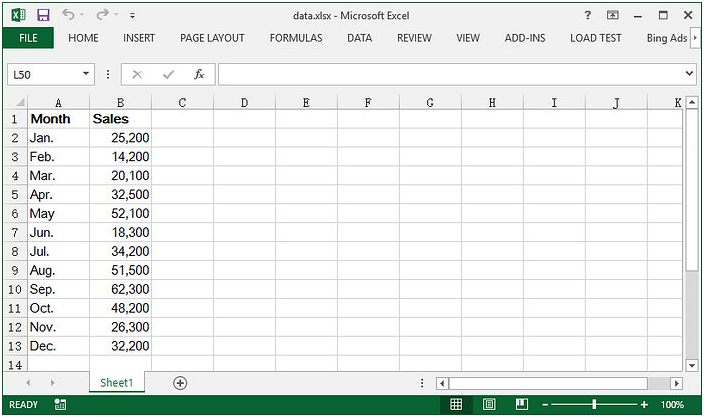
Here is the Excel sheet containing our sample data.
Step 1: Create a Presentation document.
Presentation ppt = new Presentation();
Step 2: Append a column chart in the first slide.
RectangleF rect = new RectangleF(40, 100, 550, 320);
IChart chart = ppt.Slides[0].Shapes.AppendChart(ChartType.ColumnClustered, rect);
Step 3: Clear the default dummy data.
chart.ChartData.Clear(0, 0, 5, 5);
Step 4: Load an existing Excel file to Workbook instance and get the first worksheet.
Workbook wb = new Workbook();
wb.LoadFromFile("data.xlsx");
Worksheet sheet = wb.Worksheets[0];
Step 5: Import data from the worksheet to chart table.
for (int r = 0; r < sheet.AllocatedRange.RowCount; r++)
{
    for (int c = 0; c < sheet.AllocatedRange.ColumnCount; c++)
    {
        chart.ChartData[r, c].Value = sheet.Range[r + 1, c + 1].Value2;
    }
}
Step 6: Set the series label and categories labels.
chart.Series.SeriesLabel = chart.ChartData["B1", "B1"];
chart.Categories.CategoryLabels = chart.ChartData["A2","A13"];
Step 7: Set the series values.
chart.Series[0].Values = chart.ChartData["B2","B13"];
Step 8: Save the file.
ppt.SaveToFile("chart.pptx",Spire.Presentation.FileFormat.Pptx2013);
Output:
Full Code:
using System;
using Spire.Presentation;
using System.Drawing;
using Spire.Presentation.Charts;
using Spire.Xls;

namespace CreateChartFromExcelData
{
    class Program
    {
        static void Main(string[] args)
        {
            //initialize an instance of Presentation class
            Presentation ppt = new Presentation();
            RectangleF rect = new RectangleF(40, 100, 550, 320);
            IChart chart = ppt.Slides[0].Shapes.AppendChart(ChartType.ColumnClustered, rect);

            //clear the default dummy data
            chart.ChartData.Clear(0, 0, 5, 5);

            //load an existing Excel file to Workbook object
            Workbook wb = new Workbook();
            wb.LoadFromFile("data.xlsx");
            Worksheet sheet = wb.Worksheets[0];

            //import data from the sheet to chart table
            for (int r = 0; r < sheet.AllocatedRange.RowCount; r++)
            {
                for (int c = 0; c < sheet.AllocatedRange.ColumnCount; c++)
                {
                    chart.ChartData[r, c].Value = sheet.Range[r + 1, c + 1].Value2;
                }
            }

            //add chart title
            chart.ChartTitle.TextProperties.Text = "Monthly Sales Report";
            chart.ChartTitle.TextProperties.IsCentered = true;
            chart.ChartTitle.Height = 30;
            chart.HasTitle = true;

            //set the series label
            chart.Series.SeriesLabel = chart.ChartData["B1", "B1"];

            //set the category labels
            chart.Categories.CategoryLabels = chart.ChartData["A2","A13"];

            //set the series values
            chart.Series[0].Values = chart.ChartData["B2","B13"];

            //save the file
            ppt.SaveToFile("chart.pptx",Spire.Presentation.FileFormat.Pptx2013);
        }
    }
}
Imports Spire.Presentation
Imports System.Drawing
Imports Spire.Presentation.Charts
Imports Spire.Xls

Namespace CreateChartFromExcelData
    Class Program
        Private Shared Sub Main(args As String())
			'initialize an instance of Presentation class
			Dim ppt As New Presentation()

            Dim rect As New RectangleF(40, 100, 550, 320)

            Dim chart As IChart = ppt.Slides(0).Shapes.AppendChart(ChartType.ColumnClustered, rect)

			'clear the default dummy data
			chart.ChartData.Clear(0, 0, 5, 5)

			'load an existing Excel file to Workbook object
			Dim wb As New Workbook()

            wb.LoadFromFile("data.xlsx")
			Dim sheet As Worksheet = wb.Worksheets(0)

			'import data from the sheet to chart table
			For r As Integer = 0 To sheet.AllocatedRange.RowCount - 1
				For c As Integer = 0 To sheet.AllocatedRange.ColumnCount - 1

                    chart.ChartData(r, c).Value = sheet.Range(r + 1, c + 1).Value2
                Next

            Next

			'add chart title
			chart.ChartTitle.TextProperties.Text = "Monthly Sales Report"
			chart.ChartTitle.TextProperties.IsCentered = True
            chart.ChartTitle.Height = 30
			chart.HasTitle = True

			'set the series label

            chart.Series.SeriesLabel = chart.ChartData("B1", "B1")

			'set the category labels

            chart.Categories.CategoryLabels = chart.ChartData("A2", "A13")

			'set the series values

            chart.Series(0).Values = chart.ChartData("B2", "B13")

			'save the file
			ppt.SaveToFile("chart.pptx", Spire.Presentation.FileFormat.Pptx2013)
		End Sub

    End Class
End Namespace
C#/VB.NET: Create a Combination Chart in PowerPoint
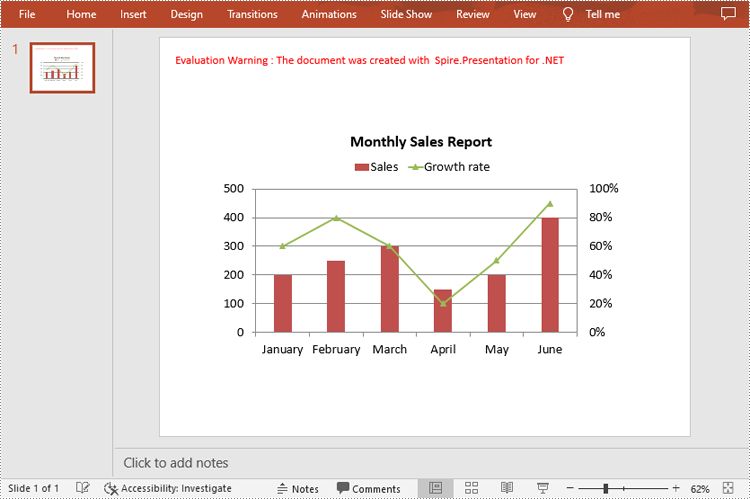
In PowerPoint, a combination chart is a type of chart that combines two or more different chart types into a single chart. It allows you to display multiple sets of data in the same chart, making it easier to compare and analyze different variables. In this article, you will learn how to programmatically create a combination chart in a PowerPoint presentation using Spire.Presentation for .NET.
Install Spire.Presentation for .NET
To begin with, you need to add the DLL files included in the Spire.Presentation for.NET package as references in your .NET project. The DLL files can be either downloaded from this link or installed via NuGet.
PM> Install-Package Spire.Presentation
Create a Combination Chart in PowerPoint in C# and VB.NET
Spire.Presentation for .NET offers the ISlide.Shapes.AppendChart(ChartType type, RectangleF rectangle) method to add a certain chart type to a slide, and then you can change the chart type of the second series to another chart to create a combo chart. The following are the steps to combine a column chart and a line chart in PowerPoint.
- Create a Presentation instance.
- Get a specified slide and add a column chart to it using ISlide.Shapes.AppendChart(ChartType.ColumnClustered, RectangleF rectangle) method.
- Create a DataTable object and add some data, then import data from data table to chart data.
- Set the chart title, categories labels, series labels and series values.
- Change the chart type of the second series to a line chart with data markers using IChart.Series[int index].Type property.
- Plot the second series on the secondary value axis by setting the IChart.Series[int index].UseSecondAxis property to true.
- Set the number format and gridlines of the secondary value axis.
- Save the result document using Presentation.SaveToFile() method.
- C#
- VB.NET
using Spire.Presentation;
using Spire.Presentation.Charts;
using Spire.Presentation.Drawing;
using System;
using System.Data;
using System.Drawing;

namespace CombinationChart
{
    class Program
    {
        static void Main(string[] args)
        {
            //Create a Presentation instance
            Presentation presentation = new Presentation();

            //Add a column clustered chart to the first slide
            RectangleF rect = new RectangleF(80, 120, 550, 320);
            IChart chart = presentation.Slides[0].Shapes.AppendChart(ChartType.ColumnClustered, rect);

            //Set and format chart title
            chart.ChartTitle.TextProperties.Text = "Monthly Sales Report";
            chart.ChartTitle.TextProperties.IsCentered = true;
            chart.ChartTitle.Height = 30;
            chart.HasTitle = true;

            //Create a datatable and add some data
            DataTable dataTable = new DataTable();
            dataTable.Columns.Add(new DataColumn("Month", Type.GetType("System.String")));
            dataTable.Columns.Add(new DataColumn("Sales", Type.GetType("System.Int32")));
            dataTable.Columns.Add(new DataColumn("Growth rate", Type.GetType("System.Decimal")));
            dataTable.Rows.Add("January", 200, 0.6);
            dataTable.Rows.Add("February", 250, 0.8);
            dataTable.Rows.Add("March", 300, 0.6);
            dataTable.Rows.Add("April", 150, 0.2);
            dataTable.Rows.Add("May", 200, 0.5);
            dataTable.Rows.Add("June", 400, 0.9);

            //Import data from datatable to chart data
            for (int c = 0; c < dataTable.Columns.Count; c++)
            {
                chart.ChartData[0, c].Text = dataTable.Columns[c].Caption;
            }
            for (int r = 0; r < dataTable.Rows.Count; r++)
            {
                object[] datas = dataTable.Rows[r].ItemArray;
                for (int c = 0; c < datas.Length; c++)
                {
                    chart.ChartData[r + 1, c].Value = datas[c];

                }
            }

            //Set series labels
            chart.Series.SeriesLabel = chart.ChartData["B1", "C1"];

            //Set categories labels
            chart.Categories.CategoryLabels = chart.ChartData["A2", "A7"];

            //Assign data to series values
            chart.Series[0].Values = chart.ChartData["B2", "B7"];
            chart.Series[1].Values = chart.ChartData["C2", "C7"];

            //Change the chart type of series 2 to a line chart with data markers
            chart.Series[1].Type = ChartType.LineMarkers;

            //Plot data of series 2 on the secondary axis
            chart.Series[1].UseSecondAxis = true;

            //Set the number format of the secondary value axis
            chart.SecondaryValueAxis.NumberFormat = "0%";

            //Hide the gridlines of the secondary value axis
            chart.SecondaryValueAxis.MajorGridTextLines.FillType = FillFormatType.None;

            //Set the legend position
            chart.ChartLegend.Position = ChartLegendPositionType.Top;

            //Set overlap
            chart.OverLap = -50;

            //Set gapwidth
            chart.GapWidth = 200;

            //Save the result document
            presentation.SaveToFile("CombinationChart.pptx", FileFormat.Pptx2010);
        }
    }
}
Apply for a Temporary License
If you'd like to remove the evaluation message from the generated documents, or to get rid of the function limitations, please request a 30-day trial license for yourself.
How to Create Doughnut Chart in PowerPoint in C#
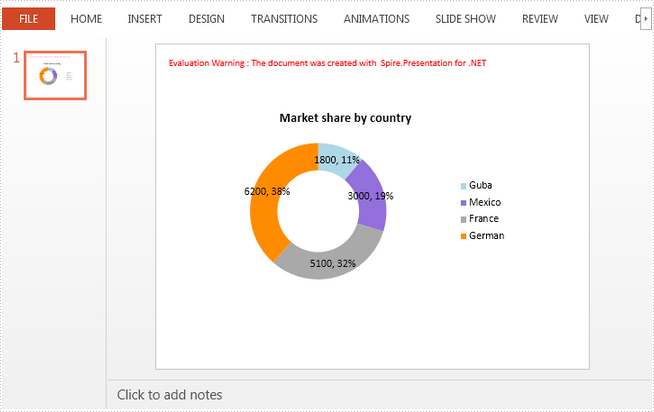
A doughnut chart (also spelled donut) is a variant of the pie chart, with a blank center allowing for additional information about the data as a whole to be included. In this article, you will learn how to create a doughnut chart in PowerPoint using Spire.Presentation.
Step 1: Initialize an instance of Presentation class.
Presentation presentation = new Presentation();
Step 2: Insert a Doughnut chart in the first slide and set the chart title.
RectangleF rect = new RectangleF(40, 100, 550, 320);
IChart chart = presentation.Slides[0].Shapes.AppendChart(ChartType.Doughnut, rect, false);
chart.ChartTitle.TextProperties.Text = "Market share by country";
chart.ChartTitle.TextProperties.IsCentered = true;
chart.ChartTitle.Height = 30;
Step 3: Define the chart data.
string[] countries = new string[] { "Guba", "Mexico","France","German" };
int[] sales = new int[] { 1800, 3000, 5100, 6200 };
chart.ChartData[0, 0].Text = "Countries";
chart.ChartData[0, 1].Text = "Sales";
for (int i = 0; i < countries.Length; ++i)
{
    chart.ChartData[i + 1, 0].Value = countries[i];
    chart.ChartData[i + 1, 1].Value = sales[i];
}
Step 4: Set the data range of category labels, series label and series values.
chart.Series.SeriesLabel = chart.ChartData["B1", "B1"];
chart.Categories.CategoryLabels = chart.ChartData["A2", "A5"];
chart.Series[0].Values = chart.ChartData["B2", "B5"];
Step 5: Add data points to series and fill each data point with different color.
for (int i = 0; i < chart.Series[0].Values.Count; i++)
{
    ChartDataPoint cdp = new ChartDataPoint(chart.Series[0]);
    cdp.Index = i;
    chart.Series[0].DataPoints.Add(cdp);
}
chart.Series[0].DataPoints[0].Fill.FillType = FillFormatType.Solid;
chart.Series[0].DataPoints[0].Fill.SolidColor.Color = Color.LightBlue;
chart.Series[0].DataPoints[1].Fill.FillType = FillFormatType.Solid;
chart.Series[0].DataPoints[1].Fill.SolidColor.Color = Color.MediumPurple;
chart.Series[0].DataPoints[2].Fill.FillType = FillFormatType.Solid;
chart.Series[0].DataPoints[2].Fill.SolidColor.Color = Color.DarkGray;
chart.Series[0].DataPoints[3].Fill.FillType = FillFormatType.Solid;
chart.Series[0].DataPoints[3].Fill.SolidColor.Color = Color.DarkOrange;
Step 6: Display value and percentage in data labels.
chart.Series[0].DataLabels.LabelValueVisible = true;
chart.Series[0].DataLabels.PercentValueVisible = true;
Step 7: Adjust the hole size of doughnut chart.
chart.Series[0].DoughnutHoleSize = 60;
Step 8: Save the file.
presentation.SaveToFile("DoughnutChart.pptx", FileFormat.Pptx2013);
Output:
Full Code:
using Spire.Presentation;
using Spire.Presentation.Charts;
using Spire.Presentation.Drawing;
using System.Drawing;

namespace SetFont
{
    class Program
    {
        static void Main(string[] args)
        {
            Presentation presentation = new Presentation();
            RectangleF rect = new RectangleF(40, 100, 550, 320);
            IChart chart = presentation.Slides[0].Shapes.AppendChart(ChartType.Doughnut, rect, false);
            chart.ChartTitle.TextProperties.Text = "Market share by country";
            chart.ChartTitle.TextProperties.IsCentered = true;
            chart.ChartTitle.Height = 30;

            string[] countries = new string[] { "Guba", "Mexico", "France", "German" };
            int[] sales = new int[] { 1800, 3000, 5100, 6200 };
            chart.ChartData[0, 0].Text = "Countries";
            chart.ChartData[0, 1].Text = "Sales";
            for (int i = 0; i < countries.Length; ++i)
            {
                chart.ChartData[i + 1, 0].Value = countries[i];
                chart.ChartData[i + 1, 1].Value = sales[i];
            }
            chart.Series.SeriesLabel = chart.ChartData["B1", "B1"];
            chart.Categories.CategoryLabels = chart.ChartData["A2", "A5"];
            chart.Series[0].Values = chart.ChartData["B2", "B5"];

            for (int i = 0; i < chart.Series[0].Values.Count; i++)
            {
                ChartDataPoint cdp = new ChartDataPoint(chart.Series[0]);
                cdp.Index = i;
                chart.Series[0].DataPoints.Add(cdp);
            }
            chart.Series[0].DataPoints[0].Fill.FillType = FillFormatType.Solid;
            chart.Series[0].DataPoints[0].Fill.SolidColor.Color = Color.LightBlue;
            chart.Series[0].DataPoints[1].Fill.FillType = FillFormatType.Solid;
            chart.Series[0].DataPoints[1].Fill.SolidColor.Color = Color.MediumPurple;
            chart.Series[0].DataPoints[2].Fill.FillType = FillFormatType.Solid;
            chart.Series[0].DataPoints[2].Fill.SolidColor.Color = Color.DarkGray;
            chart.Series[0].DataPoints[3].Fill.FillType = FillFormatType.Solid;
            chart.Series[0].DataPoints[3].Fill.SolidColor.Color = Color.DarkOrange;

            chart.Series[0].DataLabels.LabelValueVisible = true;
            chart.Series[0].DataLabels.PercentValueVisible = true;
            chart.Series[0].DoughnutHoleSize = 60;

            presentation.SaveToFile("DoughnutChart.pptx", FileFormat.Pptx2013);
        }
    }
}
Set font for the text on Chart title in C#
We have already shown you how to set font for the text on Chart legend and Chart Axis in C# by using Spire.Presentation. This article will focus on demonstrating how to set font for text on chart title in C#.
Here comes the code snippets:
Step 1: Create a presentation instance and load the document from file.
Presentation presentation = new Presentation();
presentation.LoadFromFile("sample.pptx", FileFormat.Pptx2010);
Step 2: Get the chart that need to be formatted the font for the text on chart title.
IChart chart = presentation.Slides[0].Shapes[0] as IChart;
Step 3: Set the font for the text on chart title area.
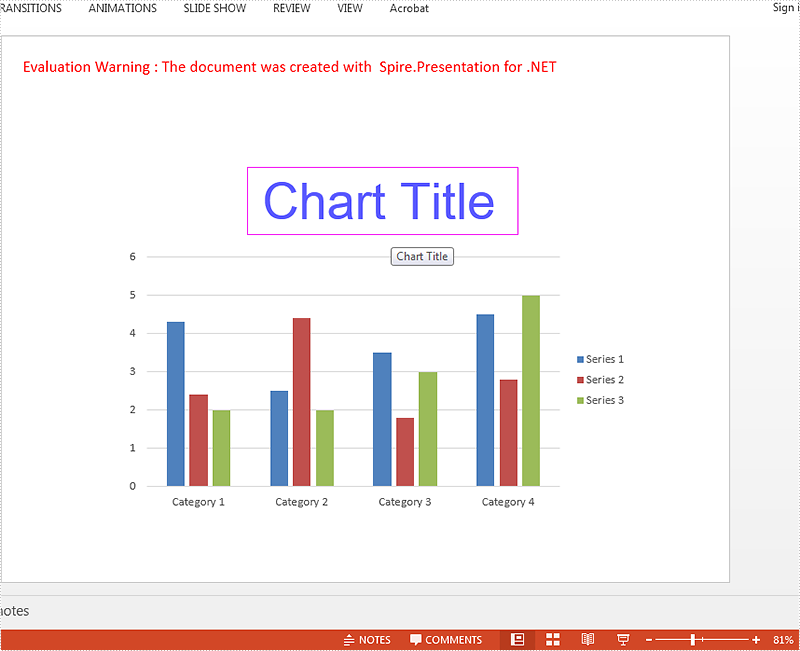
chart.ChartTitle.TextProperties.Paragraphs[0].DefaultCharacterProperties.LatinFont = new TextFont("Arial Unicode MS");
chart.ChartTitle.TextProperties.Paragraphs[0].DefaultCharacterProperties.Fill.SolidColor.KnownColor = KnownColors.Blue;
chart.ChartTitle.TextProperties.Paragraphs[0].DefaultCharacterProperties.FontHeight = 50;
Step 4: Save the document to file:
presentation.SaveToFile("result.pptx", FileFormat.Pptx2010);
Effective screenshot after formatting the font for the chart title.
Full codes:
using Spire.Presentation;
using Spire.Presentation.Charts;

namespace SetFont
{
    class Program
    {
        static void Main(string[] args)
        {
            Presentation presentation = new Presentation();
            presentation.LoadFromFile("sample.pptx", FileFormat.Pptx2010);

            IChart chart = presentation.Slides[0].Shapes[0] as IChart;

            chart.ChartTitle.TextProperties.Paragraphs[0].DefaultCharacterProperties.LatinFont = new TextFont("Arial Unicode MS");
            chart.ChartTitle.TextProperties.Paragraphs[0].DefaultCharacterProperties.Fill.SolidColor.KnownColor = KnownColors.Blue;
            chart.ChartTitle.TextProperties.Paragraphs[0].DefaultCharacterProperties.FontHeight = 50;

            presentation.SaveToFile("result.pptx", FileFormat.Pptx2010);
        }
    }
}
How to Remove Chart from a PowerPoint Slide in C#, VB.NET
In previous topics, we demonstrated how to create, format, protect and copy chart in PowerPoint. In this article, we'll show you how to remove chart from a specific slide by using Spire.Presentation.
Below is a sample document which contains a chart and a textbox on the first slide, then we'll remove the chart from the slide.
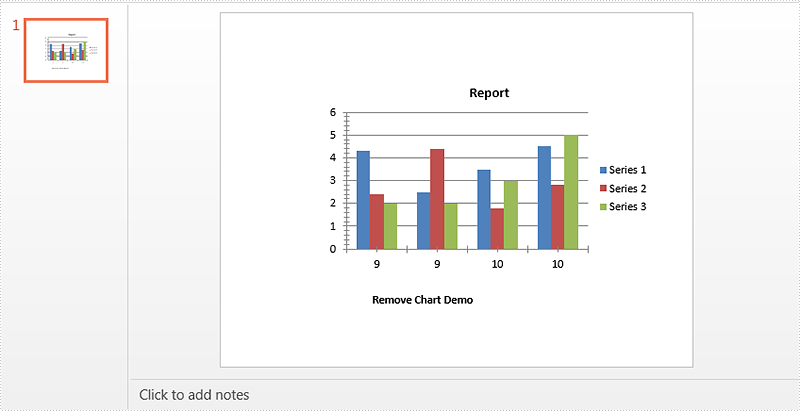
Code Snippets:
Step 1: Instantiate a Presentation object and load the PowerPoint document.
Presentation ppt = new Presentation();
ppt.LoadFromFile("Sample.pptx");
Step 2: Get the first slide from the document.
ISlide slide = ppt.Slides[0];
Step 3: Remove chart from the slide.
for(int i = 0; i < slide.Shapes.Count; i++)
{
    IShape shape = slide.Shapes[i] as IShape;
    if(shape is IChart)
    {
        slide.Shapes.Remove(shape);
    }
}
Step 4: Save the document.
ppt.SaveToFile("result.pptx", FileFormat.Pptx2010);
Effective screenshot:
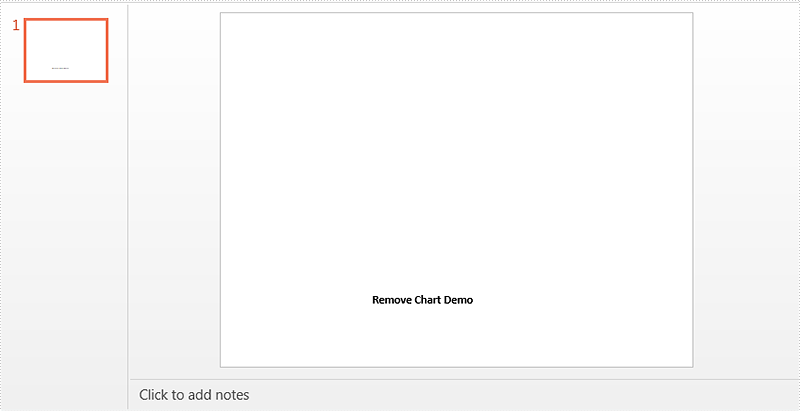
Full code:
using Spire.Presentation;
using Spire.Presentation.Charts;

namespace Remove_Chart_in_PowerPoint
{
    class Program
    {
        static void Main(string[] args)
        {
            Presentation ppt = new Presentation();
            ppt.LoadFromFile("Sample.pptx");
            ISlide slide = ppt.Slides[0];
            for(int i = 0; i < slide.Shapes.Count; i++)
            {
                IShape shape = slide.Shapes[i] as IShape;
                if(shape is IChart)
                {
                    slide.Shapes.Remove(shape);
                }
            }
            ppt.SaveToFile("result.pptx", FileFormat.Pptx2010);
        }
    }
}
Imports Spire.Presentation
Imports Spire.Presentation.Charts

Namespace Remove_Chart_in_PowerPoint
	Class Program
		Private Shared Sub Main(args As String())
			Dim ppt As New Presentation()
			ppt.LoadFromFile("Sample.pptx")
			Dim slide As ISlide = ppt.Slides(0)
			For i As Integer = 0 To slide.Shapes.Count - 1
				Dim shape As IShape = TryCast(slide.Shapes(i), IShape)
				If TypeOf shape Is IChart Then
					slide.Shapes.Remove(shape)
				End If
			Next
			ppt.SaveToFile("result.pptx", FileFormat.Pptx2010)
		End Sub
	End Class
End Namespace
Set font for the text on Chart legend and Chart Axis in C#
Spire.Presentation offers multiple functions to set the format for the chart elements. We have already shown you how to set the color for datapoints of series and format data labels of chart series in the PowerPoint document. This article will focus on demonstrating how to set font for text on chart legend and chart axis in C#.
Firstly please check the custom chart on presentation slides:
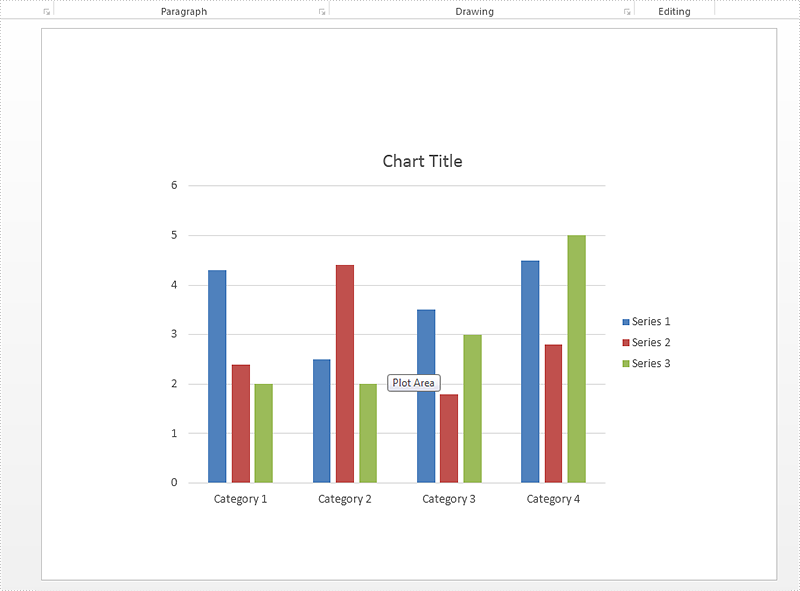
Step 1: Create a presentation instance and load the document from file.
Presentation presentation = new Presentation();
presentation.LoadFromFile("sample.pptx", FileFormat.Pptx2010);
Step 2: Get the chart that need to be formatted the font for the text on chart legend and chart axis.
IChart chart = presentation.Slides[0].Shapes[0] as IChart;
Step 3: Set the font for the text on Chart Legend area.
chart.ChartLegend.TextProperties.Paragraphs[0].DefaultCharacterProperties.Fill.SolidColor.KnownColor = KnownColors.Red;
chart.ChartLegend.TextProperties.Paragraphs[0].DefaultCharacterProperties.LatinFont = new TextFont("Arial Unicode MS");
Step 4: Set the font for the text on Chart Axis area.
chart.PrimaryCategoryAxis.TextProperties.Paragraphs[0].DefaultCharacterProperties.Fill.SolidColor.KnownColor = KnownColors.Red;
chart.PrimaryCategoryAxis.TextProperties.Paragraphs[0].DefaultCharacterProperties.Fill.FillType = FillFormatType.Solid;
chart.PrimaryCategoryAxis.TextProperties.Paragraphs[0].DefaultCharacterProperties.FontHeight = 10;
chart.PrimaryCategoryAxis.TextProperties.Paragraphs[0].DefaultCharacterProperties.LatinFont = new TextFont("Arial Unicode MS");
Step 5: Save the document to file:
presentation.SaveToFile("result.pptx", FileFormat.Pptx2010);
Effective screenshot after formatting the font for the chart legend and chart Axis.
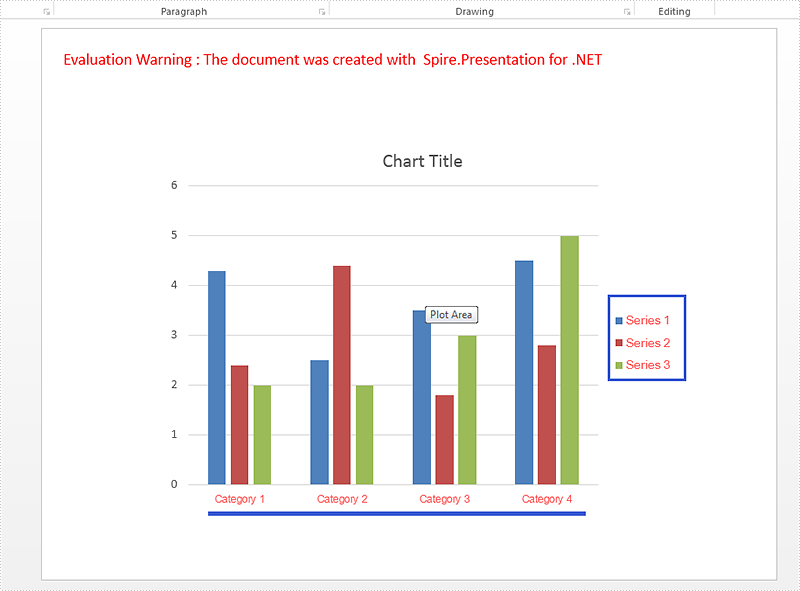
Full codes:
using Spire.Presentation;
using Spire.Presentation.Charts;
using Spire.Presentation.Drawing;

namespace SetFont
{
    class Program
    {
        static void Main(string[] args)
        {
            Presentation presentation = new Presentation();
            presentation.LoadFromFile("sample.pptx", FileFormat.Pptx2010);

            IChart chart = presentation.Slides[0].Shapes[0] as IChart;

            chart.ChartLegend.TextProperties.Paragraphs[0].DefaultCharacterProperties.Fill.SolidColor.KnownColor = KnownColors.Red;
            chart.ChartLegend.TextProperties.Paragraphs[0].DefaultCharacterProperties.LatinFont = new TextFont("Arial Unicode MS");

            chart.PrimaryCategoryAxis.TextProperties.Paragraphs[0].DefaultCharacterProperties.Fill.SolidColor.KnownColor = KnownColors.Red;
            chart.PrimaryCategoryAxis.TextProperties.Paragraphs[0].DefaultCharacterProperties.Fill.FillType = FillFormatType.Solid;
            chart.PrimaryCategoryAxis.TextProperties.Paragraphs[0].DefaultCharacterProperties.FontHeight = 10;
            chart.PrimaryCategoryAxis.TextProperties.Paragraphs[0].DefaultCharacterProperties.LatinFont = new TextFont("Arial Unicode MS");

            presentation.SaveToFile("result.pptx", FileFormat.Pptx2010);

        }
    }
}
Working with Tick-mark Labels on the Category Axis in C#, VB.NET
In charts, each category on the category axis is identified by a tick-mark label and separated from other categories by tick marks. The tick-mark label text comes from the name of the associated category and is usually placed next to the axis.
In this article, we will introduce how we can custom the tick-mark labels by changing the labels' position, rotating labels and specifying interval between labels in C#, VB.ENT.
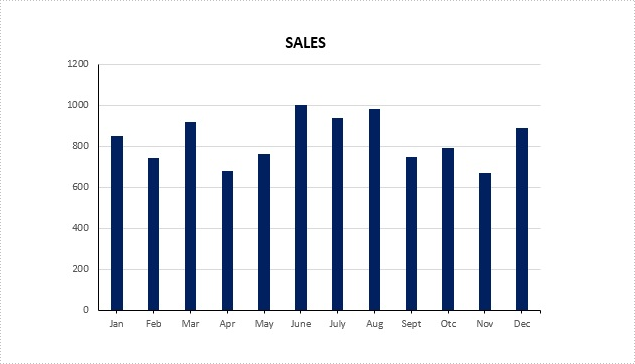
Figure 1 – Chart in Example File
To facilitate the introduction, we prepared a PowerPoint document that contains a column chart looks like the screenshot in Figure 1 and used below code to get the chart from the PowerPoint slide. Then we're able to custom the labels through the following ways.
Presentation ppt = new Presentation(@"C:\Users\Administrator\Desktop\ColumnChart.pptx",FileFormat.Pptx2013);
IChart chart = ppt.Slides[0].Shapes[0] as IChart;
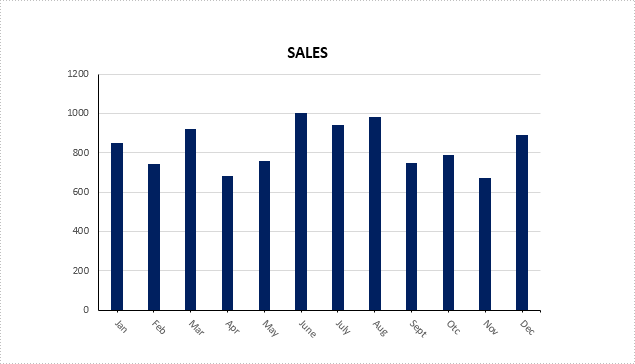
Rotate tick labels
chart.PrimaryCategoryAxis.TextRotationAngle = 45;
Specify interval between labels
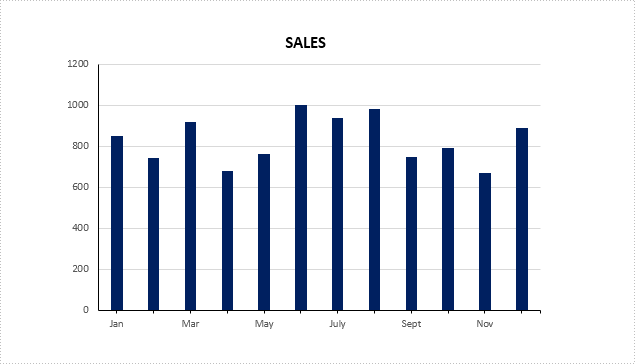
To change the number of unlabeled tick marks, we must set IsAutomaticTickLabelSpacing property as false and change the TickLabelSpacing property to any number between 1 - 255.
chart.PrimaryCategoryAxis.IsAutomaticTickLabelSpacing = false;
chart.PrimaryCategoryAxis.TickLabelSpacing = 2;
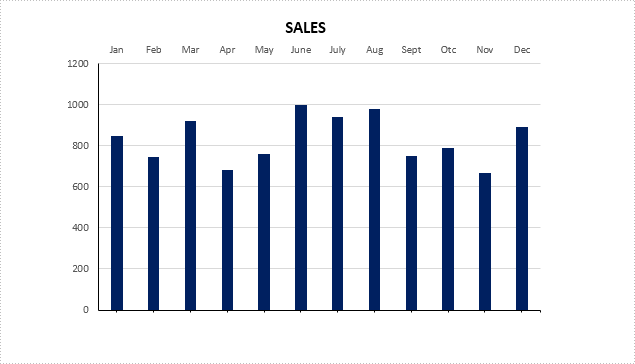
Change tick labels' position
chart.PrimaryCategoryAxis.TickLabelPosition = TickLabelPositionType.TickLabelPositionHigh;
Full Code:
using Spire.Presentation;
using Spire.Presentation.Charts;

namespace TickMarkLabel
{
    class Program
    {
        static void Main(string[] args)
        {
            Presentation ppt = new Presentation(@"C:\Users\Administrator\Desktop\ColumnChart.pptx", FileFormat.Pptx2013);
            IChart chart = ppt.Slides[0].Shapes[0] as IChart;

            //rotate tick labels
            chart.PrimaryCategoryAxis.TextRotationAngle = 45;

            //specify interval between labels
            chart.PrimaryCategoryAxis.IsAutomaticTickLabelSpacing = false;
            chart.PrimaryCategoryAxis.TickLabelSpacing = 2;

            ////change position
            //chart.PrimaryCategoryAxis.TickLabelPosition = TickLabelPositionType.TickLabelPositionHigh;

            ppt.SaveToFile("result.pptx", FileFormat.Pptx2013);

        }
    }
}
Imports Spire.Presentation
Imports Spire.Presentation.Charts

Namespace TickMarkLabel
	Class Program
		Private Shared Sub Main(args As String())
			Dim ppt As New Presentation("C:\Users\Administrator\Desktop\ColumnChart.pptx", FileFormat.Pptx2013)
			Dim chart As IChart = TryCast(ppt.Slides(0).Shapes(0), IChart)

			'rotate tick labels
			chart.PrimaryCategoryAxis.TextRotationAngle = 45

			'specify interval between labels
			chart.PrimaryCategoryAxis.IsAutomaticTickLabelSpacing = False
			chart.PrimaryCategoryAxis.TickLabelSpacing = 2

			'''/change position
			'chart.PrimaryCategoryAxis.TickLabelPosition = TickLabelPositionType.TickLabelPositionHigh;

			ppt.SaveToFile("result.pptx", FileFormat.Pptx2013)

		End Sub
	End Class
End Namespace
How to Create Pie Chart in PowerPoint in C#
A pie chart helps show proportions and percentages between categories, by dividing a circle into proportional segments. This article will introduce how to create a pie chart that looks like the below screenshot in PowerPoint document using Spire.Presentation in C#.
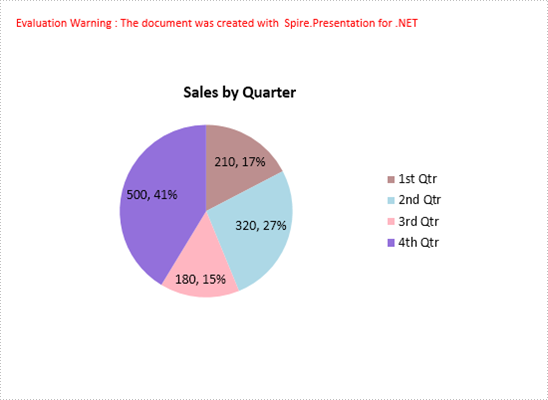
Code Snippets:
Step 1: Initialize an instance of Presentation class.
Presentation ppt = new Presentation();
Step 2: Insert a Pie chart to the first slide by calling the AppendChart() method and set the chart title.
RectangleF rect1 = new RectangleF(40, 100, 550, 320);
IChart chart = ppt.Slides[0].Shapes.AppendChart(ChartType.Pie, rect1, false);
chart.ChartTitle.TextProperties.Text = "Sales by Quarter";
chart.ChartTitle.TextProperties.IsCentered = true;
chart.ChartTitle.Height = 30;
chart.HasTitle = true;
Step 3: Define some data.
string[] quarters = new string[] { "1st Qtr", "2nd Qtr", "3rd Qtr", "4th Qtr" };
int[] sales = new int[] { 210, 320, 180, 500 };
Step 4: Append data to ChartData, which represents a data table where the chart data is stored.
chart.ChartData[0, 0].Text = "Quarters";
chart.ChartData[0, 1].Text = "Sales";
for (int i = 0; i < quarters.Length; ++i)
{
    chart.ChartData[i + 1, 0].Value = quarters[i];
    chart.ChartData[i + 1, 1].Value = sales[i];
}
Step 5: Set category labels, series label and series data.
chart.Series.SeriesLabel = chart.ChartData["B1", "B1"];
chart.Categories.CategoryLabels = chart.ChartData["A2", "A5"];
chart.Series[0].Values = chart.ChartData["B2", "B5"];
Step 6: Add data points to series and fill each data point with different color.
for (int i = 0; i < chart.Series[0].Values.Count; i++)
{
    ChartDataPoint cdp = new ChartDataPoint(chart.Series[0]);
    cdp.Index = i;
    chart.Series[0].DataPoints.Add(cdp);

}
chart.Series[0].DataPoints[0].Fill.FillType = FillFormatType.Solid;
chart.Series[0].DataPoints[0].Fill.SolidColor.Color = Color.RosyBrown;
chart.Series[0].DataPoints[1].Fill.FillType = FillFormatType.Solid;
chart.Series[0].DataPoints[1].Fill.SolidColor.Color = Color.LightBlue;
chart.Series[0].DataPoints[2].Fill.FillType = FillFormatType.Solid;
chart.Series[0].DataPoints[2].Fill.SolidColor.Color = Color.LightPink;
chart.Series[0].DataPoints[3].Fill.FillType = FillFormatType.Solid;
chart.Series[0].DataPoints[3].Fill.SolidColor.Color = Color.MediumPurple;
Step 7: Set the data labels to display label value and percentage value.
chart.Series[0].DataLabels.LabelValueVisible = true;
chart.Series[0].DataLabels.PercentValueVisible = true;
Step 8: Save the file.
ppt.SaveToFile("PieChart.pptx", FileFormat.Pptx2010);
Full Code:
using Spire.Presentation;
using Spire.Presentation.Charts;
using Spire.Presentation.Drawing;
using System.Drawing;


namespace CreatePieChartInPowerPoint
{
    class Program
    {
        static void Main(string[] args)
        {

            Presentation ppt = new Presentation();

            RectangleF rect1 = new RectangleF(40, 100, 550, 320);
            IChart chart = ppt.Slides[0].Shapes.AppendChart(ChartType.Pie, rect1, false);
            chart.ChartTitle.TextProperties.Text = "Sales by Quarter";
            chart.ChartTitle.TextProperties.IsCentered = true;
            chart.ChartTitle.Height = 30;
            chart.HasTitle = true;

            string[] quarters = new string[] { "1st Qtr", "2nd Qtr", "3rd Qtr", "4th Qtr" };
            int[] sales = new int[] { 210, 320, 180, 500 };
            chart.ChartData[0, 0].Text = "Quarters";
            chart.ChartData[0, 1].Text = "Sales";
            for (int i = 0; i < quarters.Length; ++i)
            {
                chart.ChartData[i + 1, 0].Value = quarters[i];
                chart.ChartData[i + 1, 1].Value = sales[i];
            }

            chart.Series.SeriesLabel = chart.ChartData["B1", "B1"];
            chart.Categories.CategoryLabels = chart.ChartData["A2", "A5"];
            chart.Series[0].Values = chart.ChartData["B2", "B5"];

            for (int i = 0; i < chart.Series[0].Values.Count; i++)
            {
                ChartDataPoint cdp = new ChartDataPoint(chart.Series[0]);
                cdp.Index = i;
                chart.Series[0].DataPoints.Add(cdp);

            }
            chart.Series[0].DataPoints[0].Fill.FillType = FillFormatType.Solid;
            chart.Series[0].DataPoints[0].Fill.SolidColor.Color = Color.RosyBrown;
            chart.Series[0].DataPoints[1].Fill.FillType = FillFormatType.Solid;
            chart.Series[0].DataPoints[1].Fill.SolidColor.Color = Color.LightBlue;
            chart.Series[0].DataPoints[2].Fill.FillType = FillFormatType.Solid;
            chart.Series[0].DataPoints[2].Fill.SolidColor.Color = Color.LightPink;
            chart.Series[0].DataPoints[3].Fill.FillType = FillFormatType.Solid;
            chart.Series[0].DataPoints[3].Fill.SolidColor.Color = Color.MediumPurple;

            chart.Series[0].DataLabels.LabelValueVisible = true;
            chart.Series[0].DataLabels.PercentValueVisible = true;

            ppt.SaveToFile("PieChart.pptx", FileFormat.Pptx2010);
            System.Diagnostics.Process.Start("PieChart.pptx");
        }
    }
}
