Spire.Presentation offers multiple functions to set the format for the chart elements. We have already shown you how to set the color for datapoints of series and format data labels of chart series in the PowerPoint document. This article will focus on demonstrating how to set font for text on chart legend and chart axis in C#.
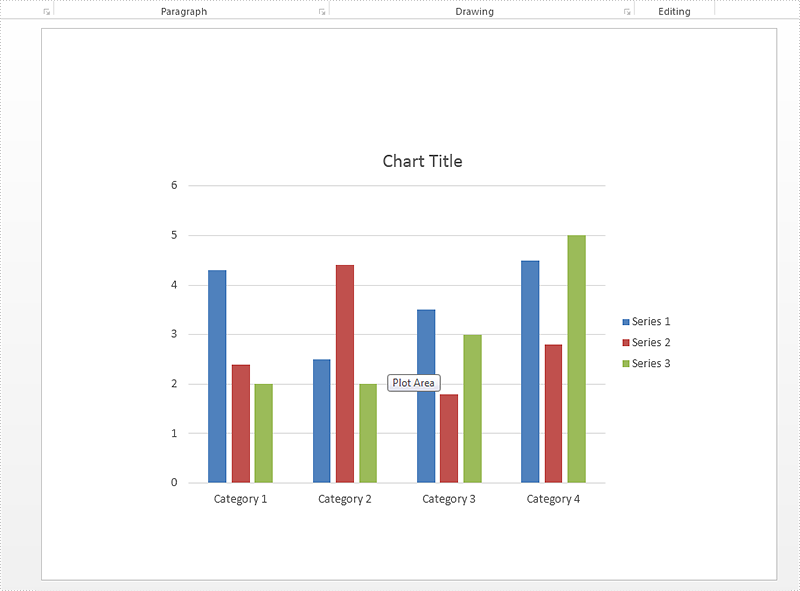
Firstly please check the custom chart on presentation slides:

Step 1: Create a presentation instance and load the document from file.
Presentation presentation = new Presentation();
presentation.LoadFromFile("sample.pptx", FileFormat.Pptx2010);
Step 2: Get the chart that need to be formatted the font for the text on chart legend and chart axis.
IChart chart = presentation.Slides[0].Shapes[0] as IChart;
Step 3: Set the font for the text on Chart Legend area.
chart.ChartLegend.TextProperties.Paragraphs[0].DefaultCharacterProperties.Fill.SolidColor.KnownColor = KnownColors.Red;
chart.ChartLegend.TextProperties.Paragraphs[0].DefaultCharacterProperties.LatinFont = new TextFont("Arial Unicode MS");
Step 4: Set the font for the text on Chart Axis area.
chart.PrimaryCategoryAxis.TextProperties.Paragraphs[0].DefaultCharacterProperties.Fill.SolidColor.KnownColor = KnownColors.Red;
chart.PrimaryCategoryAxis.TextProperties.Paragraphs[0].DefaultCharacterProperties.Fill.FillType = FillFormatType.Solid;
chart.PrimaryCategoryAxis.TextProperties.Paragraphs[0].DefaultCharacterProperties.FontHeight = 10;
chart.PrimaryCategoryAxis.TextProperties.Paragraphs[0].DefaultCharacterProperties.LatinFont = new TextFont("Arial Unicode MS");
Step 5: Save the document to file:
presentation.SaveToFile("result.pptx", FileFormat.Pptx2010);
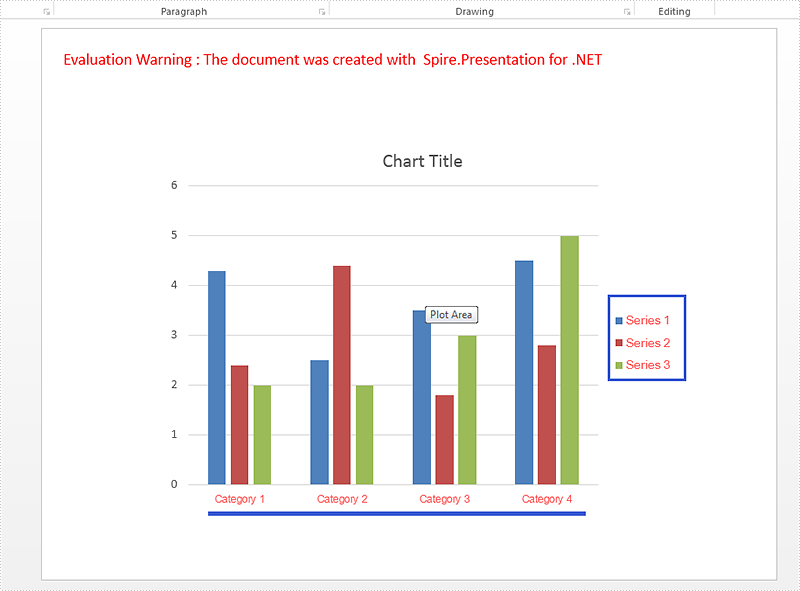
Effective screenshot after formatting the font for the chart legend and chart Axis.

Full codes:
using Spire.Presentation;
using Spire.Presentation.Charts;
using Spire.Presentation.Drawing;

namespace SetFont
{
    class Program
    {
        static void Main(string[] args)
        {
            Presentation presentation = new Presentation();
            presentation.LoadFromFile("sample.pptx", FileFormat.Pptx2010);

            IChart chart = presentation.Slides[0].Shapes[0] as IChart;

            chart.ChartLegend.TextProperties.Paragraphs[0].DefaultCharacterProperties.Fill.SolidColor.KnownColor = KnownColors.Red;
            chart.ChartLegend.TextProperties.Paragraphs[0].DefaultCharacterProperties.LatinFont = new TextFont("Arial Unicode MS");

            chart.PrimaryCategoryAxis.TextProperties.Paragraphs[0].DefaultCharacterProperties.Fill.SolidColor.KnownColor = KnownColors.Red;
            chart.PrimaryCategoryAxis.TextProperties.Paragraphs[0].DefaultCharacterProperties.Fill.FillType = FillFormatType.Solid;
            chart.PrimaryCategoryAxis.TextProperties.Paragraphs[0].DefaultCharacterProperties.FontHeight = 10;
            chart.PrimaryCategoryAxis.TextProperties.Paragraphs[0].DefaultCharacterProperties.LatinFont = new TextFont("Arial Unicode MS");

            presentation.SaveToFile("result.pptx", FileFormat.Pptx2010);

        }
    }
}


