Creating charts in PowerPoint slides is a powerful way to enhance presentations by visually representing complex information, making it easier for audiences to grasp key insights. By reading Excel data directly to generate charts, you can streamline the data entry process and ensure data accuracy. Or, if you want to use charts from Excel files directly in PowerPoint presentations, you can directly insert them as pictures into PowerPoint slides, thus maximizing the original formatting and appearance. This article will show how to create charts in PowerPoint slides from Excel data using Spire.Office for .NET in .NET programs.
- Create Charts in PowerPoint Slides with Excel Data using C#
- Insert Excel Charts into PowerPoint Slides as Images using C#
Install Spire.Office for .NET
To begin with, you need to add the DLL files included in the Spire.Office for.NET package as references in your .NET project. The DLL files can be either downloaded from this link or installed via NuGet.
PM> Install-Package Spire.Office
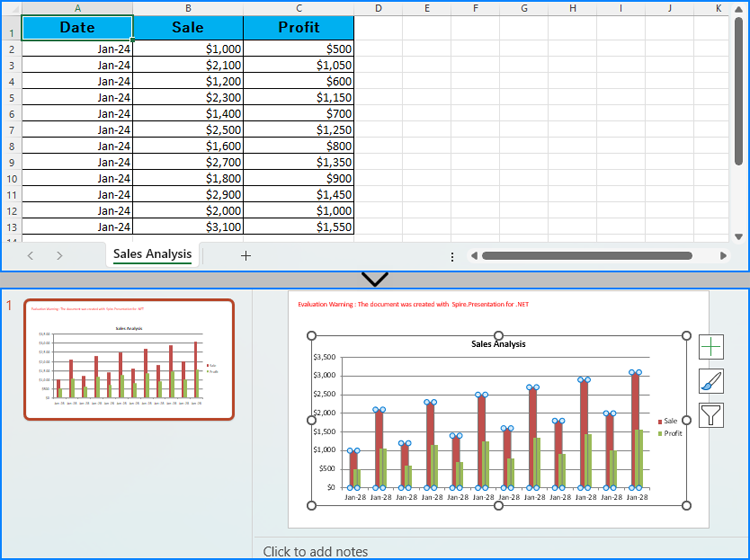
Create Charts in PowerPoint Slides with Excel Data using C#
Developers can read data from Excel worksheets with Spire.XLS for .NET and then create charts in PowerPoint slides with Spire.Presentation for .NET using the read data as the charts' data source. The detailed steps for creating charts in PowerPoint presentations with Excel file data are as follows:
- Create an instance of Presentation class.
- Create an instance of Workbook class and load an Excel file using Workbook.LoadFromFile() method.
- Get the first slide in the presentation through Presentation.Slides[] property and create a chart in the first slide of the presentation using ISlide.Shapes.AppendChart() method.
- Clear the default dummy data using IChart.ChartData.Clear() method.
- Get the first worksheet in the workbook through Workbook.Worksheets[] property.
- Iterate through rows in the worksheet and then the columns in the worksheet:
- Get the cell values in the worksheet through Worksheet.AllocatedRange[].Value2 property and set them as the values of the chart’s data through IChart.ChartData[].Value property.
- Set the chart title using properties under IChart.ChartTitle property.
- Set the chart series labels and category labels through IChart.Series.SeriesLabel and IChart.Categories.CategoryLabels properties.
- Set the series values through IChart.Series[].Values property.
- Set the number format of the axis through IChart.PrimaryCategoryAxis.NumberFormat and IChart.PrimaryValueAxis.NumberFormat properties.
- Set the style of the chart through IChart.ChartStyle property.
- Save the presentation using Presentation.SaveToFile() method.
- C#
using Spire.Presentation;
using Spire.Presentation.Charts;
using Spire.Xls;
using System.Drawing;
using FileFormat = Spire.Presentation.FileFormat;
using IChart = Spire.Presentation.Charts.IChart;

namespace PresentationChartExcelData
{
    class Program
    {
        public static void Main(string[] args)
        {
            // Create an instance of Presentation class
            Presentation presentation = new Presentation();

            // Set the slide size
            presentation.SlideSize.Type = SlideSizeType.Screen16x9;

            // Create an instance of Workbook class and load an Excel file
            Workbook workbook = new Workbook();
            workbook.LoadFromFile("Sample.xlsx");

            // Get the first worksheet in the workbook
            Worksheet sheet = workbook.Worksheets[0];

            // Create a chart in the presentation
            RectangleF rect = new RectangleF(50, 100, presentation.SlideSize.Size.Width - 100, presentation.SlideSize.Size.Height - 150);
            ISlide slide = presentation.Slides[0];
            IChart chart = slide.Shapes.AppendChart(ChartType.ColumnClustered, rect);

            // Clear the default dummy data
            chart.ChartData.Clear(0, 0, 5, 5);

            // Iterate through the rows in the worksheet
            for (int i = 0; i < sheet.AllocatedRange.RowCount; i++)
            {
                // Iterate through the columns in the worksheet
                for (int j = 0; j < sheet.AllocatedRange.ColumnCount; j++)
                {
                    // Set the cell values in the worksheet as the values of the chart data
                    chart.ChartData[i, j].Value = sheet.AllocatedRange[i + 1, j + 1].Value2;
                    // Copy number formats
                    chart.ChartData[i, j].NumberFormat = sheet.AllocatedRange[i + 1, j + 1].NumberFormat;
                }
            }

            // Set the chart title
            chart.ChartTitle.TextProperties.Text = sheet.Name;
            chart.ChartTitle.TextProperties.IsCentered = true;
            chart.ChartTitle.Height = 25;
            chart.HasTitle = true;

            // Set the series labels and category labels
            chart.Series.SeriesLabel = chart.ChartData["B1", "C1"];
            chart.Categories.CategoryLabels = chart.ChartData["A2", "A" + sheet.AllocatedRange.RowCount];

            // Set the series values
            chart.Series[0].Values = chart.ChartData["B2", "B" + sheet.AllocatedRange.RowCount];
            chart.Series[1].Values = chart.ChartData["C2", "C" + sheet.AllocatedRange.RowCount];

            // Set the number format of the axis
            chart.PrimaryCategoryAxis.NumberFormat = sheet.AllocatedRange["A2"].NumberFormat;
            chart.PrimaryValueAxis.NumberFormat = sheet.AllocatedRange["B2"].NumberFormat;

            // Set the style of the chart
            chart.ChartStyle = ChartStyle.Style2;

            // Set the overlap and gap width
            chart.OverLap = 50;
            chart.GapWidth = 200;

            // Save the presentation
            presentation.SaveToFile("output/PresentationChartExcelData.pptx", FileFormat.Pptx2019);
            presentation.Dispose();
            workbook.Dispose();
        }
    }
}
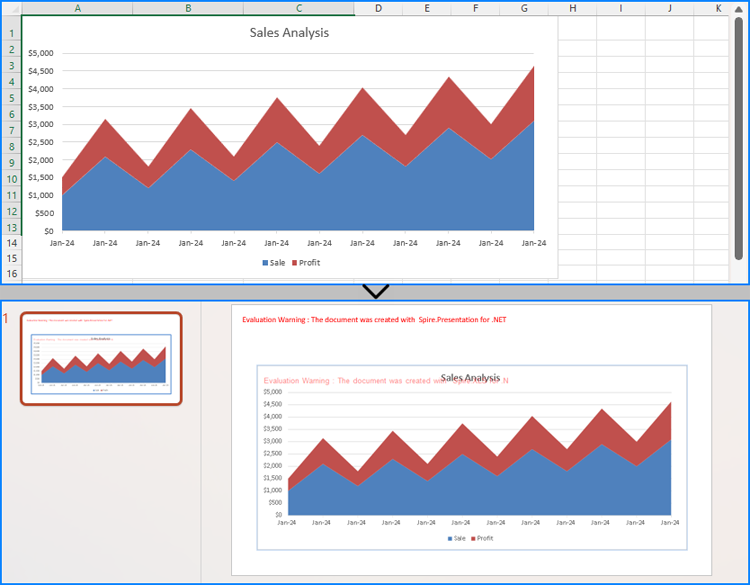
Insert Excel Charts into PowerPoint Slides as Images using C#
To insert an existing chart from an Excel worksheet into a PowerPoint slide while maintaining its appearance and formatting precisely, the Workbook.SaveChartAsImage() method can be employed. This method allows the Excel chart to be saved as an image, which can then be added to the slide. The specific steps are as follows:
- Create an instance of Presentation class.
- Create an instance of Workbook class and load an Excel file using Workbook.LoadFromFile() method.
- Save a chart in a worksheet as an image using Workbook.SaveChartAsImage() method.
- Embed the image into the presentation using Presentation.Images.Append() method.
- Add the image to a slide using Presentation.Slides[].AppendEmbedImage() method.
- Save the presentation using Presentation.SaveToFile() method.
- C#
using Spire.Presentation;
using Spire.Presentation.Drawing;
using Spire.Xls;
using System.Drawing;
using FileFormat = Spire.Presentation.FileFormat;

namespace PresentationChartExcelChart
{
    class Program
    {
        public static void Main(string[] args)
        {
            // Create an instance of Presentation class
            Presentation presentation = new Presentation();

            // Set the slide size
            presentation.SlideSize.Type = SlideSizeType.Screen16x9;

            // Create an instance of Workbook class and load an Excel file
            Workbook workbook = new Workbook();
            workbook.LoadFromFile("Sample.xlsx");

            // Save the first chart in the first worksheet as an image
            Image image = workbook.SaveChartAsImage(workbook.Worksheets[0], 0);

            // Embed the image into the presentation
            IImageData imageData = presentation.Images.Append(image);

            // Add the image to the first slide
            RectangleF rect = new RectangleF(50, 120, presentation.SlideSize.Size.Width - 100, presentation.SlideSize.Size.Height - 170);
            presentation.Slides[0].Shapes.AppendEmbedImage(ShapeType.Rectangle, imageData, rect);

            // Save the presentation
            presentation.SaveToFile("output/PresentationChartExcelChart.pptx", FileFormat.Pptx2019);
            presentation.Dispose();
            workbook.Dispose();
        }
    }
}
Apply for a Temporary License
If you'd like to remove the evaluation message from the generated documents, or to get rid of the function limitations, please request a 30-day trial license for yourself.