Sparklines in Excel are small, lightweight charts that fit inside individual cells of a worksheet. They are particularly useful for showing variations in data across rows or columns, allowing users to quickly identify trends without taking up much space. In this article, we'll demonstrate how to insert, modify, and delete sparklines in Excel in Python using Spire.XLS for Python.
- Insert a Sparkline in Excel in Python
- Modify a Sparkline in Excel in Python
- Delete Sparklines from Excel in Python
Install Spire.XLS for Python
This scenario requires Spire.XLS for Python and plum-dispatch v1.7.4. They can be easily installed in your Windows through the following pip command.
pip install Spire.XLS
If you are unsure how to install, please refer to this tutorial: How to Install Spire.XLS for Python on Windows
Insert a Sparkline in Excel in Python
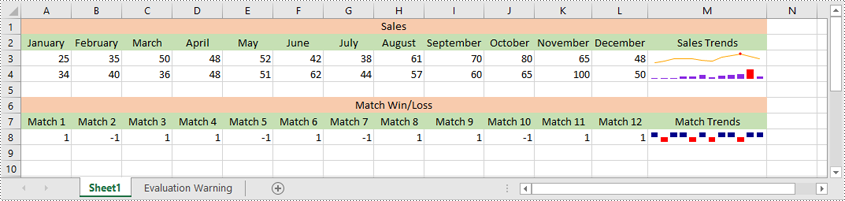
Excel offers 3 main types of sparklines:
- Line Sparkline: Shows data trends as a line, similar to a miniature line graph.
- Column Sparkline: Displays data as vertical bars, emphasizing individual data points.
- Win/Loss Sparkline: Illustrates positive and negative values, useful for tracking binary outcomes like wins or losses.
Spire.XLS for Python supports inserting all of the above types of sparklines. Below are the detailed steps for inserting a sparkline in Excel using Spire.XLS for Python:
- Create an object of the Workbook class.
- Load an Excel file using Workbook.LoadFromFile() method.
- Get a specific worksheet using Workbook.Worksheets[index] property.
- Add a sparkline group to the worksheet using Worksheet.SparklineGroups.AddGroup() method.
- Specify the sparkline type, color, and data point color for the sparkline group.
- Add a sparkline collection to the group using SparklineGroup.Add() method, and then add a sparkline to the collection using SparklineCollection.Add() method.
- Save the resulting file using Workbook.SaveToFile() method.
- Python
from spire.xls import *
from spire.xls.common import *

# Create a Workbook object
workbook = Workbook()
# Load an Excel file
workbook.LoadFromFile("Sample.xlsx")

# Get the first worksheet in the workbook
sheet = workbook.Worksheets[0]

# Add a sparkline group to the worksheet
sparkline_group1 = sheet.SparklineGroups.AddGroup()
# Set the sparkline type to line
sparkline_group1.SparklineType = SparklineType.Line
# Set the sparkline color
sparkline_group1.SparklineColor = Color.get_Orange()
# Set the highest data point color
sparkline_group1.HighPointColor = Color.get_Red()
# Add a sparkline collection
sparklines1 = sparkline_group1.Add()
# Add a sparkline to the collection, define the data range for the sparkline and the target cell for displaying the sparkline
sparklines1.Add(sheet.Range["A3:L3"], sheet.Range["M3"])

# Add a sparkline group to the worksheet
sparkline_group2 = sheet.SparklineGroups.AddGroup()
# Set the sparkline type to column
sparkline_group2.SparklineType = SparklineType.Column
# Set the sparkline color
sparkline_group2.SparklineColor = Color.get_BlueViolet()
# Set the highest data point color
sparkline_group2.HighPointColor = Color.get_Red()
# Add a sparkline collection
sparklines2 = sparkline_group2.Add()
# Add a sparkline to the collection, define the data range for the sparkline and the target cell for displaying the sparkline
sparklines2.Add(sheet.Range["A4:L4"], sheet.Range["M4"])

# Add a sparkline group to the worksheet
sparkline_group3 = sheet.SparklineGroups.AddGroup()
# Set the sparkline type to stacked (win/loss)
sparkline_group3.SparklineType = SparklineType.Stacked
# Set the sparkline color
sparkline_group3.SparklineColor = Color.get_DarkBlue()
# Set the negative data point color
sparkline_group3.NegativePointColor = Color.get_Red()
# Add a sparkline collection
sparklines3 = sparkline_group3.Add()
# Add a sparkline to the collection, define the data range for the sparkline and the target cell for displaying the sparkline
sparklines3.Add(sheet.Range["A8:L8"], sheet.Range["M8"])

# Save the resulting workbook to file
workbook.SaveToFile("AddSparklines.xlsx", ExcelVersion.Version2016)
workbook.Dispose()
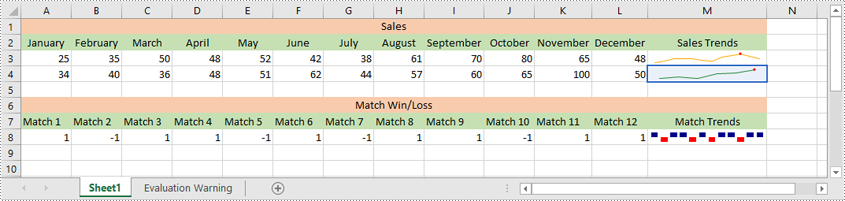
Modify a Sparkline in Excel in Python
After inserting a sparkline, you can modify its type, color, and data source to make it more effective at displaying the information you need.
The following steps explain how to modify a sparkline in Excel using Spire.XLS for Python:
- Create an object of the Workbook class.
- Load an Excel file using Workbook.LoadFromFile() method.
- Get a specific worksheet using Workbook.Worksheets[index] property.
- Get a specific sparkline group in the worksheet using Worksheet.SparklineGroups[index] property.
- Change the sparkline type and color for the sparkline group using SparklineGroup.SparklineType and SparklineGroup.SparklineColor properties.
- Get a specific sparkline in the group and change its data source using ISparklines.RefreshRanges() method.
- Save the resulting file using Workbook.SaveToFile() method.
- Python
from spire.xls import *
from spire.xls.common import *

# Create a Workbook object
workbook = Workbook()
# Load an Excel file that contains sparklines
workbook.LoadFromFile("AddSparklines.xlsx")

# Get the first worksheet in the workbook
sheet = workbook.Worksheets[0]

# Get the second sparkline group
sparklineGroup = sheet.SparklineGroups[1]
# Change the sparkline type
sparklineGroup.SparklineType = SparklineType.Line
# Change the sparkline color
sparklineGroup.SparklineColor = Color.get_ForestGreen()

# Change the data range of the sparkline
sparklines = sparklineGroup[0]
sparklines.RefreshRanges(sheet.Range["A4:F4"], sheet.Range["M4"])

# Save the resulting workbook to file
workbook.SaveToFile("ModifySparklines.xlsx", ExcelVersion.Version2016)
workbook.Dispose()
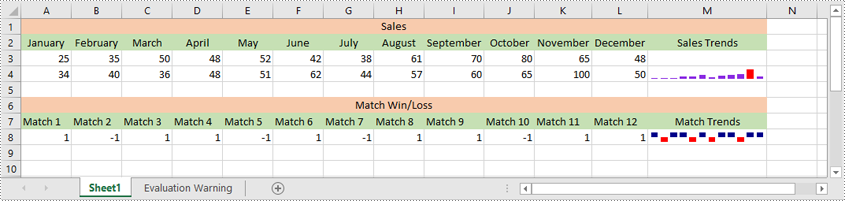
Delete Sparklines from Excel in Python
Spire.XLS for Python allows you to remove specific sparklines from a sparkline group and to remove the entire sparkline group from an Excel worksheet.
The following steps explain how to remove an entire sparkline group or specific sparklines from a sparkline group using Spire.XLS for Python:
- Create an object of the Workbook class
- Load an Excel file using Workbook.LoadFromFile() method.
- Get a specific worksheet using Workbook.Worksheets[index] property.
- Get a specific sparkline group in the worksheet using Worksheet.SparklineGroups[index] property.
- Delete the entire sparkline group using Worksheet.SparklineGroups.Clear() method. Or delete a specific sparkline using ISparklines.Remove() method.
- Save the resulting file using Workbook.SaveToFile() method.
- Python
from spire.xls import *
from spire.xls.common import *

# Create a Workbook object
workbook = Workbook()
# Load an Excel file that contains sparklines
workbook.LoadFromFile("AddSparklines.xlsx")

# Get the first worksheet in the workbook
sheet = workbook.Worksheets[0]

# Get the first sparkline group in the worksheet
sparklineGroup = sheet.SparklineGroups[0]
# Remove the first sparkline group from the worksheet
sheet.SparklineGroups.Clear(sparklineGroup)

# # Remove the first sparkline
# sparklines = sparklineGroup[0]
# sparklines.Remove(sparklines[0])

# Save the resulting workbook to file
workbook.SaveToFile("RemoveSparklines.xlsx", ExcelVersion.Version2016)
workbook.Dispose()
Apply for a Temporary License
If you'd like to remove the evaluation message from the generated documents, or to get rid of the function limitations, please request a 30-day trial license for yourself.