
Chart (31)
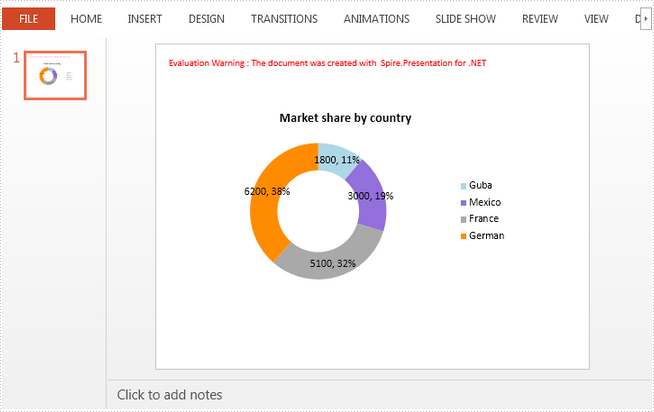
A doughnut chart (also spelled donut) is a variant of the pie chart, with a blank center allowing for additional information about the data as a whole to be included. In this article, you will learn how to create a doughnut chart in PowerPoint using Spire.Presentation.
Step 1: Initialize an instance of Presentation class.
Presentation presentation = new Presentation();
Step 2: Insert a Doughnut chart in the first slide and set the chart title.
RectangleF rect = new RectangleF(40, 100, 550, 320);
IChart chart = presentation.Slides[0].Shapes.AppendChart(ChartType.Doughnut, rect, false);
chart.ChartTitle.TextProperties.Text = "Market share by country";
chart.ChartTitle.TextProperties.IsCentered = true;
chart.ChartTitle.Height = 30;
Step 3: Define the chart data.
string[] countries = new string[] { "Guba", "Mexico","France","German" };
int[] sales = new int[] { 1800, 3000, 5100, 6200 };
chart.ChartData[0, 0].Text = "Countries";
chart.ChartData[0, 1].Text = "Sales";
for (int i = 0; i < countries.Length; ++i)
{
    chart.ChartData[i + 1, 0].Value = countries[i];
    chart.ChartData[i + 1, 1].Value = sales[i];
}
Step 4: Set the data range of category labels, series label and series values.
chart.Series.SeriesLabel = chart.ChartData["B1", "B1"];
chart.Categories.CategoryLabels = chart.ChartData["A2", "A5"];
chart.Series[0].Values = chart.ChartData["B2", "B5"];
Step 5: Add data points to series and fill each data point with different color.
for (int i = 0; i < chart.Series[0].Values.Count; i++)
{
    ChartDataPoint cdp = new ChartDataPoint(chart.Series[0]);
    cdp.Index = i;
    chart.Series[0].DataPoints.Add(cdp);
}
chart.Series[0].DataPoints[0].Fill.FillType = FillFormatType.Solid;
chart.Series[0].DataPoints[0].Fill.SolidColor.Color = Color.LightBlue;
chart.Series[0].DataPoints[1].Fill.FillType = FillFormatType.Solid;
chart.Series[0].DataPoints[1].Fill.SolidColor.Color = Color.MediumPurple;
chart.Series[0].DataPoints[2].Fill.FillType = FillFormatType.Solid;
chart.Series[0].DataPoints[2].Fill.SolidColor.Color = Color.DarkGray;
chart.Series[0].DataPoints[3].Fill.FillType = FillFormatType.Solid;
chart.Series[0].DataPoints[3].Fill.SolidColor.Color = Color.DarkOrange;
Step 6: Display value and percentage in data labels.
chart.Series[0].DataLabels.LabelValueVisible = true;
chart.Series[0].DataLabels.PercentValueVisible = true;
Step 7: Adjust the hole size of doughnut chart.
chart.Series[0].DoughnutHoleSize = 60;
Step 8: Save the file.
presentation.SaveToFile("DoughnutChart.pptx", FileFormat.Pptx2013);
Output:
Full Code:
using Spire.Presentation;
using Spire.Presentation.Charts;
using Spire.Presentation.Drawing;
using System.Drawing;

namespace SetFont
{
    class Program
    {
        static void Main(string[] args)
        {
            Presentation presentation = new Presentation();
            RectangleF rect = new RectangleF(40, 100, 550, 320);
            IChart chart = presentation.Slides[0].Shapes.AppendChart(ChartType.Doughnut, rect, false);
            chart.ChartTitle.TextProperties.Text = "Market share by country";
            chart.ChartTitle.TextProperties.IsCentered = true;
            chart.ChartTitle.Height = 30;

            string[] countries = new string[] { "Guba", "Mexico", "France", "German" };
            int[] sales = new int[] { 1800, 3000, 5100, 6200 };
            chart.ChartData[0, 0].Text = "Countries";
            chart.ChartData[0, 1].Text = "Sales";
            for (int i = 0; i < countries.Length; ++i)
            {
                chart.ChartData[i + 1, 0].Value = countries[i];
                chart.ChartData[i + 1, 1].Value = sales[i];
            }
            chart.Series.SeriesLabel = chart.ChartData["B1", "B1"];
            chart.Categories.CategoryLabels = chart.ChartData["A2", "A5"];
            chart.Series[0].Values = chart.ChartData["B2", "B5"];

            for (int i = 0; i < chart.Series[0].Values.Count; i++)
            {
                ChartDataPoint cdp = new ChartDataPoint(chart.Series[0]);
                cdp.Index = i;
                chart.Series[0].DataPoints.Add(cdp);
            }
            chart.Series[0].DataPoints[0].Fill.FillType = FillFormatType.Solid;
            chart.Series[0].DataPoints[0].Fill.SolidColor.Color = Color.LightBlue;
            chart.Series[0].DataPoints[1].Fill.FillType = FillFormatType.Solid;
            chart.Series[0].DataPoints[1].Fill.SolidColor.Color = Color.MediumPurple;
            chart.Series[0].DataPoints[2].Fill.FillType = FillFormatType.Solid;
            chart.Series[0].DataPoints[2].Fill.SolidColor.Color = Color.DarkGray;
            chart.Series[0].DataPoints[3].Fill.FillType = FillFormatType.Solid;
            chart.Series[0].DataPoints[3].Fill.SolidColor.Color = Color.DarkOrange;

            chart.Series[0].DataLabels.LabelValueVisible = true;
            chart.Series[0].DataLabels.PercentValueVisible = true;
            chart.Series[0].DoughnutHoleSize = 60;

            presentation.SaveToFile("DoughnutChart.pptx", FileFormat.Pptx2013);
        }
    }
}
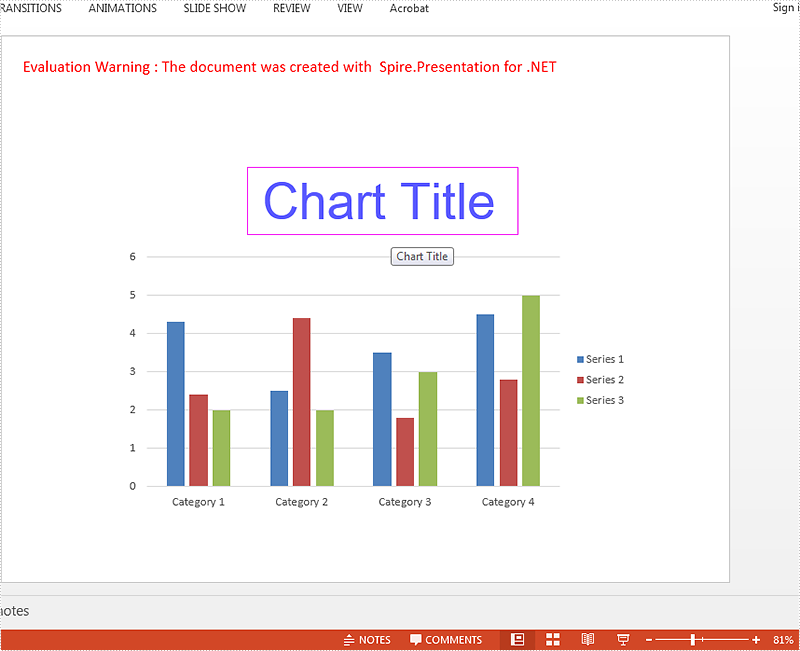
We have already shown you how to set font for the text on Chart legend and Chart Axis in C# by using Spire.Presentation. This article will focus on demonstrating how to set font for text on chart title in C#.
Here comes the code snippets:
Step 1: Create a presentation instance and load the document from file.
Presentation presentation = new Presentation();
presentation.LoadFromFile("sample.pptx", FileFormat.Pptx2010);
Step 2: Get the chart that need to be formatted the font for the text on chart title.
IChart chart = presentation.Slides[0].Shapes[0] as IChart;
Step 3: Set the font for the text on chart title area.
chart.ChartTitle.TextProperties.Paragraphs[0].DefaultCharacterProperties.LatinFont = new TextFont("Arial Unicode MS");
chart.ChartTitle.TextProperties.Paragraphs[0].DefaultCharacterProperties.Fill.SolidColor.KnownColor = KnownColors.Blue;
chart.ChartTitle.TextProperties.Paragraphs[0].DefaultCharacterProperties.FontHeight = 50;
Step 4: Save the document to file:
presentation.SaveToFile("result.pptx", FileFormat.Pptx2010);
Effective screenshot after formatting the font for the chart title.
Full codes:
using Spire.Presentation;
using Spire.Presentation.Charts;

namespace SetFont
{
    class Program
    {
        static void Main(string[] args)
        {
            Presentation presentation = new Presentation();
            presentation.LoadFromFile("sample.pptx", FileFormat.Pptx2010);

            IChart chart = presentation.Slides[0].Shapes[0] as IChart;

            chart.ChartTitle.TextProperties.Paragraphs[0].DefaultCharacterProperties.LatinFont = new TextFont("Arial Unicode MS");
            chart.ChartTitle.TextProperties.Paragraphs[0].DefaultCharacterProperties.Fill.SolidColor.KnownColor = KnownColors.Blue;
            chart.ChartTitle.TextProperties.Paragraphs[0].DefaultCharacterProperties.FontHeight = 50;

            presentation.SaveToFile("result.pptx", FileFormat.Pptx2010);
        }
    }
}
How to Remove Chart from a PowerPoint Slide in C#, VB.NET
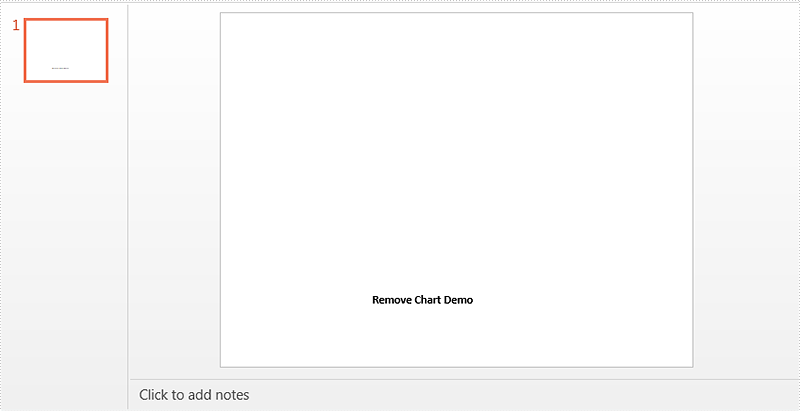
2016-12-15 08:33:30 Written by support iceblueIn previous topics, we demonstrated how to create, format, protect and copy chart in PowerPoint. In this article, we'll show you how to remove chart from a specific slide by using Spire.Presentation.
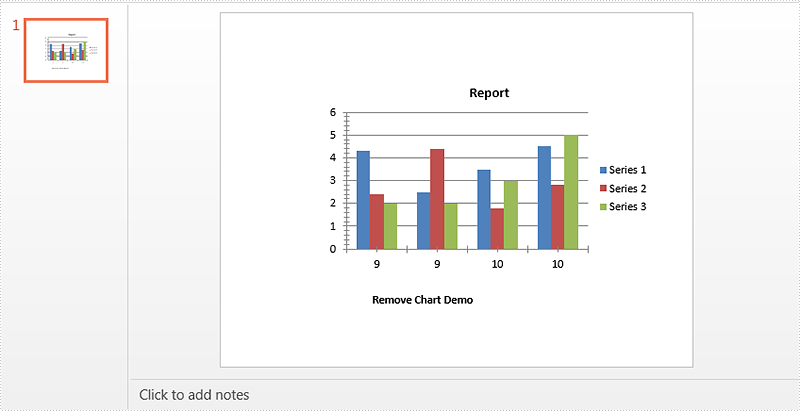
Below is a sample document which contains a chart and a textbox on the first slide, then we'll remove the chart from the slide.
Code Snippets:
Step 1: Instantiate a Presentation object and load the PowerPoint document.
Presentation ppt = new Presentation();
ppt.LoadFromFile("Sample.pptx");
Step 2: Get the first slide from the document.
ISlide slide = ppt.Slides[0];
Step 3: Remove chart from the slide.
for(int i = 0; i < slide.Shapes.Count; i++)
{
    IShape shape = slide.Shapes[i] as IShape;
    if(shape is IChart)
    {
        slide.Shapes.Remove(shape);
    }
}
Step 4: Save the document.
ppt.SaveToFile("result.pptx", FileFormat.Pptx2010);
Effective screenshot:
Full code:
using Spire.Presentation;
using Spire.Presentation.Charts;

namespace Remove_Chart_in_PowerPoint
{
    class Program
    {
        static void Main(string[] args)
        {
            Presentation ppt = new Presentation();
            ppt.LoadFromFile("Sample.pptx");
            ISlide slide = ppt.Slides[0];
            for(int i = 0; i < slide.Shapes.Count; i++)
            {
                IShape shape = slide.Shapes[i] as IShape;
                if(shape is IChart)
                {
                    slide.Shapes.Remove(shape);
                }
            }
            ppt.SaveToFile("result.pptx", FileFormat.Pptx2010);
        }
    }
}
Imports Spire.Presentation
Imports Spire.Presentation.Charts

Namespace Remove_Chart_in_PowerPoint
	Class Program
		Private Shared Sub Main(args As String())
			Dim ppt As New Presentation()
			ppt.LoadFromFile("Sample.pptx")
			Dim slide As ISlide = ppt.Slides(0)
			For i As Integer = 0 To slide.Shapes.Count - 1
				Dim shape As IShape = TryCast(slide.Shapes(i), IShape)
				If TypeOf shape Is IChart Then
					slide.Shapes.Remove(shape)
				End If
			Next
			ppt.SaveToFile("result.pptx", FileFormat.Pptx2010)
		End Sub
	End Class
End Namespace
Set font for the text on Chart legend and Chart Axis in C#
2016-12-08 09:20:48 Written by support iceblueSpire.Presentation offers multiple functions to set the format for the chart elements. We have already shown you how to set the color for datapoints of series and format data labels of chart series in the PowerPoint document. This article will focus on demonstrating how to set font for text on chart legend and chart axis in C#.
Firstly please check the custom chart on presentation slides:
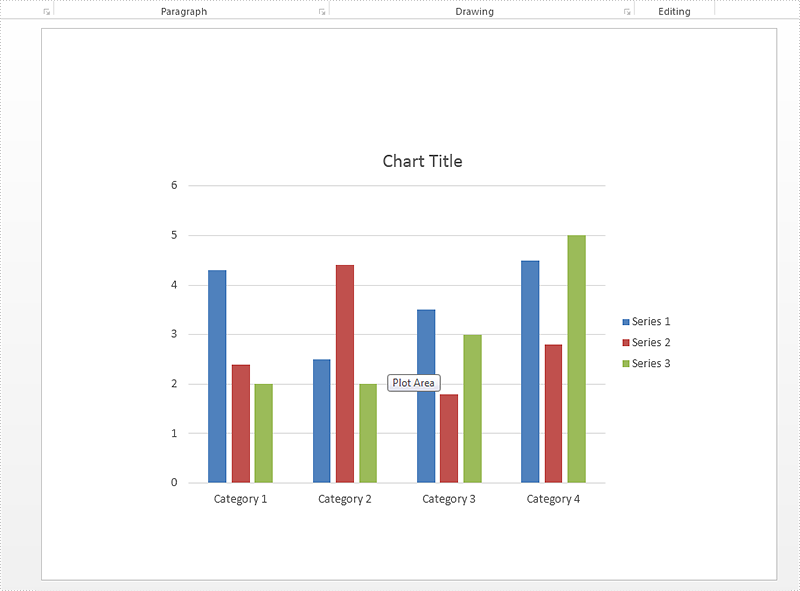
Step 1: Create a presentation instance and load the document from file.
Presentation presentation = new Presentation();
presentation.LoadFromFile("sample.pptx", FileFormat.Pptx2010);
Step 2: Get the chart that need to be formatted the font for the text on chart legend and chart axis.
IChart chart = presentation.Slides[0].Shapes[0] as IChart;
Step 3: Set the font for the text on Chart Legend area.
chart.ChartLegend.TextProperties.Paragraphs[0].DefaultCharacterProperties.Fill.SolidColor.KnownColor = KnownColors.Red;
chart.ChartLegend.TextProperties.Paragraphs[0].DefaultCharacterProperties.LatinFont = new TextFont("Arial Unicode MS");
Step 4: Set the font for the text on Chart Axis area.
chart.PrimaryCategoryAxis.TextProperties.Paragraphs[0].DefaultCharacterProperties.Fill.SolidColor.KnownColor = KnownColors.Red;
chart.PrimaryCategoryAxis.TextProperties.Paragraphs[0].DefaultCharacterProperties.Fill.FillType = FillFormatType.Solid;
chart.PrimaryCategoryAxis.TextProperties.Paragraphs[0].DefaultCharacterProperties.FontHeight = 10;
chart.PrimaryCategoryAxis.TextProperties.Paragraphs[0].DefaultCharacterProperties.LatinFont = new TextFont("Arial Unicode MS");
Step 5: Save the document to file:
presentation.SaveToFile("result.pptx", FileFormat.Pptx2010);
Effective screenshot after formatting the font for the chart legend and chart Axis.
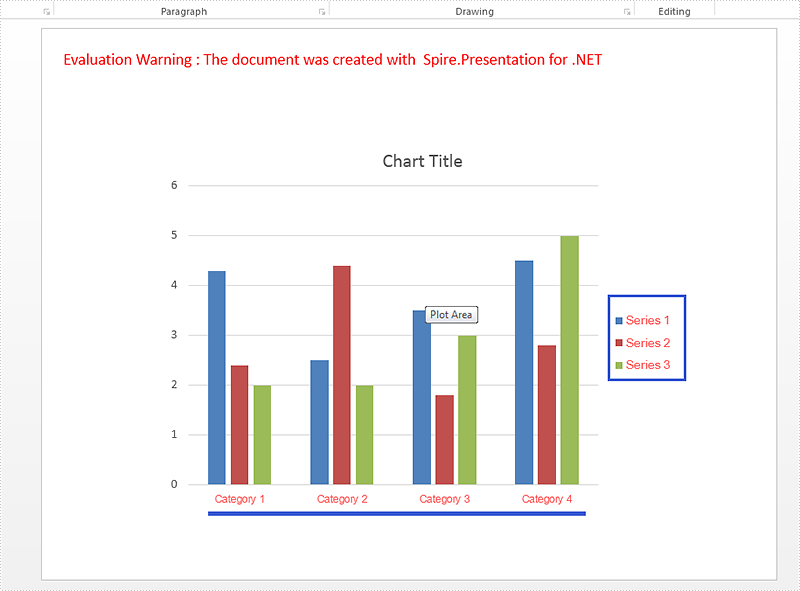
Full codes:
using Spire.Presentation;
using Spire.Presentation.Charts;
using Spire.Presentation.Drawing;

namespace SetFont
{
    class Program
    {
        static void Main(string[] args)
        {
            Presentation presentation = new Presentation();
            presentation.LoadFromFile("sample.pptx", FileFormat.Pptx2010);

            IChart chart = presentation.Slides[0].Shapes[0] as IChart;

            chart.ChartLegend.TextProperties.Paragraphs[0].DefaultCharacterProperties.Fill.SolidColor.KnownColor = KnownColors.Red;
            chart.ChartLegend.TextProperties.Paragraphs[0].DefaultCharacterProperties.LatinFont = new TextFont("Arial Unicode MS");

            chart.PrimaryCategoryAxis.TextProperties.Paragraphs[0].DefaultCharacterProperties.Fill.SolidColor.KnownColor = KnownColors.Red;
            chart.PrimaryCategoryAxis.TextProperties.Paragraphs[0].DefaultCharacterProperties.Fill.FillType = FillFormatType.Solid;
            chart.PrimaryCategoryAxis.TextProperties.Paragraphs[0].DefaultCharacterProperties.FontHeight = 10;
            chart.PrimaryCategoryAxis.TextProperties.Paragraphs[0].DefaultCharacterProperties.LatinFont = new TextFont("Arial Unicode MS");

            presentation.SaveToFile("result.pptx", FileFormat.Pptx2010);

        }
    }
}
Working with Tick-mark Labels on the Category Axis in C#, VB.NET
2016-11-16 08:24:51 Written by support iceblueIn charts, each category on the category axis is identified by a tick-mark label and separated from other categories by tick marks. The tick-mark label text comes from the name of the associated category and is usually placed next to the axis.
In this article, we will introduce how we can custom the tick-mark labels by changing the labels' position, rotating labels and specifying interval between labels in C#, VB.ENT.
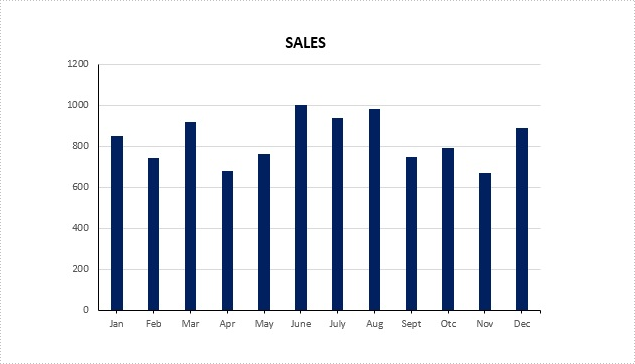
Figure 1 – Chart in Example File
To facilitate the introduction, we prepared a PowerPoint document that contains a column chart looks like the screenshot in Figure 1 and used below code to get the chart from the PowerPoint slide. Then we're able to custom the labels through the following ways.
Presentation ppt = new Presentation(@"C:\Users\Administrator\Desktop\ColumnChart.pptx",FileFormat.Pptx2013);
IChart chart = ppt.Slides[0].Shapes[0] as IChart;
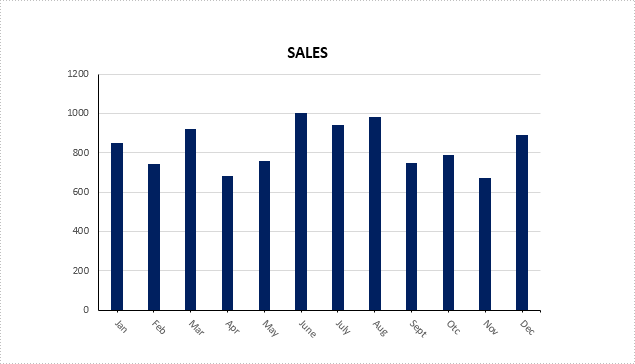
Rotate tick labels
chart.PrimaryCategoryAxis.TextRotationAngle = 45;
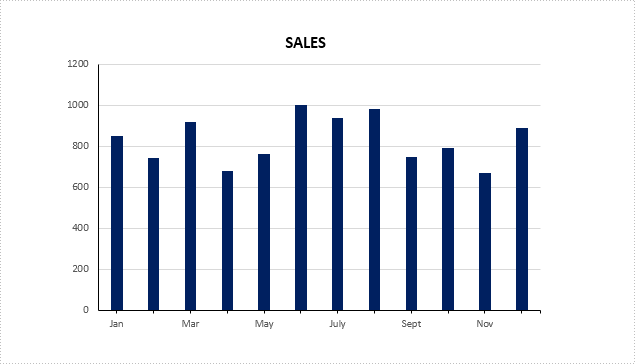
Specify interval between labels
To change the number of unlabeled tick marks, we must set IsAutomaticTickLabelSpacing property as false and change the TickLabelSpacing property to any number between 1 - 255.
chart.PrimaryCategoryAxis.IsAutomaticTickLabelSpacing = false;
chart.PrimaryCategoryAxis.TickLabelSpacing = 2;
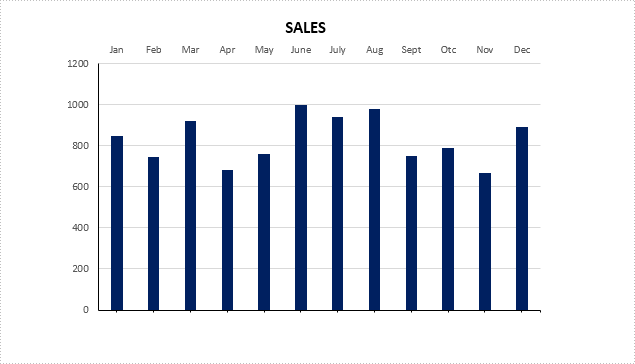
Change tick labels' position
chart.PrimaryCategoryAxis.TickLabelPosition = TickLabelPositionType.TickLabelPositionHigh;
Full Code:
using Spire.Presentation;
using Spire.Presentation.Charts;

namespace TickMarkLabel
{
    class Program
    {
        static void Main(string[] args)
        {
            Presentation ppt = new Presentation(@"C:\Users\Administrator\Desktop\ColumnChart.pptx", FileFormat.Pptx2013);
            IChart chart = ppt.Slides[0].Shapes[0] as IChart;

            //rotate tick labels
            chart.PrimaryCategoryAxis.TextRotationAngle = 45;

            //specify interval between labels
            chart.PrimaryCategoryAxis.IsAutomaticTickLabelSpacing = false;
            chart.PrimaryCategoryAxis.TickLabelSpacing = 2;

            ////change position
            //chart.PrimaryCategoryAxis.TickLabelPosition = TickLabelPositionType.TickLabelPositionHigh;

            ppt.SaveToFile("result.pptx", FileFormat.Pptx2013);

        }
    }
}
Imports Spire.Presentation
Imports Spire.Presentation.Charts

Namespace TickMarkLabel
	Class Program
		Private Shared Sub Main(args As String())
			Dim ppt As New Presentation("C:\Users\Administrator\Desktop\ColumnChart.pptx", FileFormat.Pptx2013)
			Dim chart As IChart = TryCast(ppt.Slides(0).Shapes(0), IChart)

			'rotate tick labels
			chart.PrimaryCategoryAxis.TextRotationAngle = 45

			'specify interval between labels
			chart.PrimaryCategoryAxis.IsAutomaticTickLabelSpacing = False
			chart.PrimaryCategoryAxis.TickLabelSpacing = 2

			'''/change position
			'chart.PrimaryCategoryAxis.TickLabelPosition = TickLabelPositionType.TickLabelPositionHigh;

			ppt.SaveToFile("result.pptx", FileFormat.Pptx2013)

		End Sub
	End Class
End Namespace
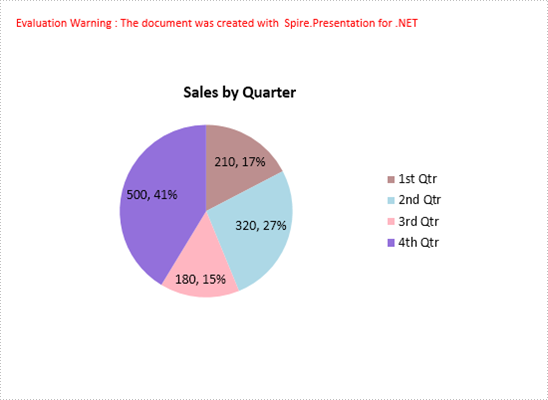
A pie chart helps show proportions and percentages between categories, by dividing a circle into proportional segments. This article will introduce how to create a pie chart that looks like the below screenshot in PowerPoint document using Spire.Presentation in C#.
Code Snippets:
Step 1: Initialize an instance of Presentation class.
Presentation ppt = new Presentation();
Step 2: Insert a Pie chart to the first slide by calling the AppendChart() method and set the chart title.
RectangleF rect1 = new RectangleF(40, 100, 550, 320);
IChart chart = ppt.Slides[0].Shapes.AppendChart(ChartType.Pie, rect1, false);
chart.ChartTitle.TextProperties.Text = "Sales by Quarter";
chart.ChartTitle.TextProperties.IsCentered = true;
chart.ChartTitle.Height = 30;
chart.HasTitle = true;
Step 3: Define some data.
string[] quarters = new string[] { "1st Qtr", "2nd Qtr", "3rd Qtr", "4th Qtr" };
int[] sales = new int[] { 210, 320, 180, 500 };
Step 4: Append data to ChartData, which represents a data table where the chart data is stored.
chart.ChartData[0, 0].Text = "Quarters";
chart.ChartData[0, 1].Text = "Sales";
for (int i = 0; i < quarters.Length; ++i)
{
    chart.ChartData[i + 1, 0].Value = quarters[i];
    chart.ChartData[i + 1, 1].Value = sales[i];
}
Step 5: Set category labels, series label and series data.
chart.Series.SeriesLabel = chart.ChartData["B1", "B1"];
chart.Categories.CategoryLabels = chart.ChartData["A2", "A5"];
chart.Series[0].Values = chart.ChartData["B2", "B5"];
Step 6: Add data points to series and fill each data point with different color.
for (int i = 0; i < chart.Series[0].Values.Count; i++)
{
    ChartDataPoint cdp = new ChartDataPoint(chart.Series[0]);
    cdp.Index = i;
    chart.Series[0].DataPoints.Add(cdp);

}
chart.Series[0].DataPoints[0].Fill.FillType = FillFormatType.Solid;
chart.Series[0].DataPoints[0].Fill.SolidColor.Color = Color.RosyBrown;
chart.Series[0].DataPoints[1].Fill.FillType = FillFormatType.Solid;
chart.Series[0].DataPoints[1].Fill.SolidColor.Color = Color.LightBlue;
chart.Series[0].DataPoints[2].Fill.FillType = FillFormatType.Solid;
chart.Series[0].DataPoints[2].Fill.SolidColor.Color = Color.LightPink;
chart.Series[0].DataPoints[3].Fill.FillType = FillFormatType.Solid;
chart.Series[0].DataPoints[3].Fill.SolidColor.Color = Color.MediumPurple;
Step 7: Set the data labels to display label value and percentage value.
chart.Series[0].DataLabels.LabelValueVisible = true;
chart.Series[0].DataLabels.PercentValueVisible = true;
Step 8: Save the file.
ppt.SaveToFile("PieChart.pptx", FileFormat.Pptx2010);
Full Code:
using Spire.Presentation;
using Spire.Presentation.Charts;
using Spire.Presentation.Drawing;
using System.Drawing;


namespace CreatePieChartInPowerPoint
{
    class Program
    {
        static void Main(string[] args)
        {

            Presentation ppt = new Presentation();

            RectangleF rect1 = new RectangleF(40, 100, 550, 320);
            IChart chart = ppt.Slides[0].Shapes.AppendChart(ChartType.Pie, rect1, false);
            chart.ChartTitle.TextProperties.Text = "Sales by Quarter";
            chart.ChartTitle.TextProperties.IsCentered = true;
            chart.ChartTitle.Height = 30;
            chart.HasTitle = true;

            string[] quarters = new string[] { "1st Qtr", "2nd Qtr", "3rd Qtr", "4th Qtr" };
            int[] sales = new int[] { 210, 320, 180, 500 };
            chart.ChartData[0, 0].Text = "Quarters";
            chart.ChartData[0, 1].Text = "Sales";
            for (int i = 0; i < quarters.Length; ++i)
            {
                chart.ChartData[i + 1, 0].Value = quarters[i];
                chart.ChartData[i + 1, 1].Value = sales[i];
            }

            chart.Series.SeriesLabel = chart.ChartData["B1", "B1"];
            chart.Categories.CategoryLabels = chart.ChartData["A2", "A5"];
            chart.Series[0].Values = chart.ChartData["B2", "B5"];

            for (int i = 0; i < chart.Series[0].Values.Count; i++)
            {
                ChartDataPoint cdp = new ChartDataPoint(chart.Series[0]);
                cdp.Index = i;
                chart.Series[0].DataPoints.Add(cdp);

            }
            chart.Series[0].DataPoints[0].Fill.FillType = FillFormatType.Solid;
            chart.Series[0].DataPoints[0].Fill.SolidColor.Color = Color.RosyBrown;
            chart.Series[0].DataPoints[1].Fill.FillType = FillFormatType.Solid;
            chart.Series[0].DataPoints[1].Fill.SolidColor.Color = Color.LightBlue;
            chart.Series[0].DataPoints[2].Fill.FillType = FillFormatType.Solid;
            chart.Series[0].DataPoints[2].Fill.SolidColor.Color = Color.LightPink;
            chart.Series[0].DataPoints[3].Fill.FillType = FillFormatType.Solid;
            chart.Series[0].DataPoints[3].Fill.SolidColor.Color = Color.MediumPurple;

            chart.Series[0].DataLabels.LabelValueVisible = true;
            chart.Series[0].DataLabels.PercentValueVisible = true;

            ppt.SaveToFile("PieChart.pptx", FileFormat.Pptx2010);
            System.Diagnostics.Process.Start("PieChart.pptx");
        }
    }
}
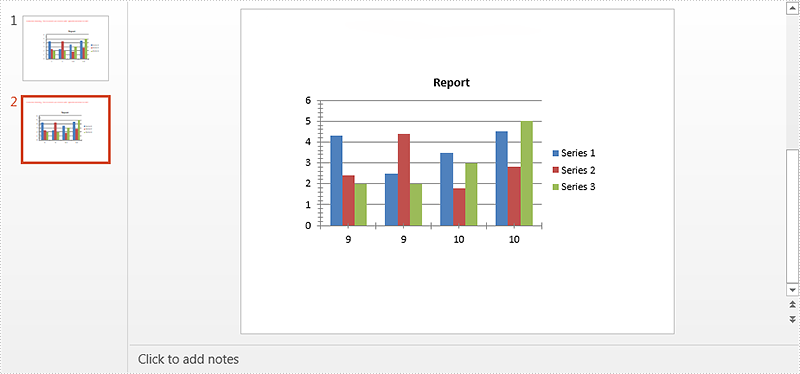
In this article, we will explain how to copy an existing chart within the same PowerPoint document or between PowerPoint documents by using Spire.Presentation. Below example called a main method public IChart CreateChart(IChart baseChart, RectangleF rectangle, int nIndex).
There are three Parameters passed in this method:
- baseChart: The source chart.
- rectangle: The area that the chart will be copied to.
- nIndex: The index of the rectangle shape. For example, -1 means append it as the last shape of the slide, 0 means append as the first shape.
Now refer to the following steps:
Copy chart within the same PowerPoint document
Step 1: Instantiate a Presentation object and load the PowerPoint document.
Presentation ppt = new Presentation();
ppt.LoadFromFile("Sample.pptx");
Step 2: Get the chart that is going to be copied.
IChart chart = ppt.Slides[0].Shapes[0] as IChart;
Step 3: Copy the chart from the first slide to the specified location of the second slide within the same document.
ppt.Slides[1].Shapes.CreateChart(chart, new RectangleF(100, 100, 500, 300), 0);
Step 4: Save the document.
ppt.SaveToFile("TestResult.pptx", FileFormat.Pptx2010);
Screenshot of copying chart within the same PowerPoint document:
Copy chart between PowerPoint documents
Step 1: Load the first PowerPoint document.
Presentation ppt1 = new Presentation();
ppt1.LoadFromFile("Sample.pptx");
Step 2: Get the chart that is going to be copied.
IChart chart = ppt1.Slides[0].Shapes[0] as IChart;
Step 3: Load the second PowerPoint document.
Presentation ppt2 = new Presentation();
ppt2.LoadFromFile("Dest.pptx");
Step 4: Copy chart from the first document to the specified location of the second document.
ppt2.Slides[0].Shapes.CreateChart(chart, new RectangleF(100, 100, 500, 300), -1);
Step 5: Save the second document.
ppt2.SaveToFile("TestResult2.pptx", FileFormat.Pptx2010);
Screenshot of copying chart between PowerPoint documents:

Full code:
Copy chart within the same PowerPoint document
using System.Drawing;
using Spire.Presentation;
using Spire.Presentation.Charts;

namespace Copy_Chart
{
    class Program
    {
        static void Main(string[] args)
        {
            Presentation ppt = new Presentation();
            ppt.LoadFromFile("Sample.pptx");
            IChart chart = ppt.Slides[0].Shapes[0] as IChart;
            ppt.Slides[1].Shapes.CreateChart(chart, new RectangleF(100, 100, 500, 300), 0);
            ppt.SaveToFile("TestResult.pptx", FileFormat.Pptx2010);
        }
    }
}
Copy chart between PowerPoint documents
using System.Drawing;
using Spire.Presentation;
using Spire.Presentation.Charts;

namespace Copy_Chart
{
    class Program
    {
        static void Main(string[] args)
        {
            Presentation ppt1 = new Presentation();
            ppt1.LoadFromFile("Sample.pptx");
            IChart chart = ppt1.Slides[0].Shapes[0] as IChart;
            Presentation ppt2 = new Presentation();
            ppt2.LoadFromFile("Dest.pptx");
            ppt2.Slides[0].Shapes.CreateChart(chart, new RectangleF(100, 100, 500, 300), -1);
            ppt2.SaveToFile("TestResult2.pptx", FileFormat.Pptx2010);
        }
    }
}
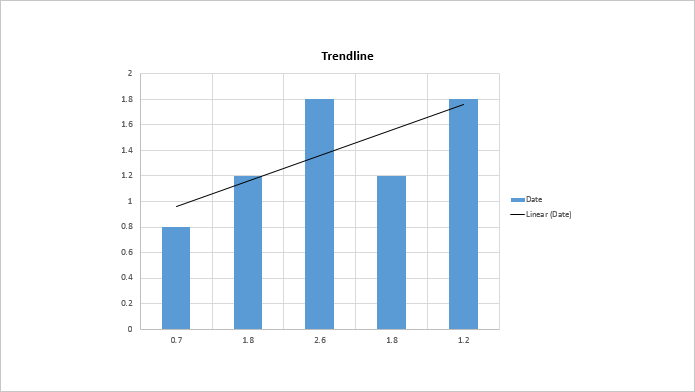
Trendline
A trendline is a line superimposed on a chart revealing the overall direction of the data. There are six different types of trendlines:
- linear
- logarithmic
- polynomial
- power
- exponential
- moving average
Add trendline for chart series
Spire.Presentation enables developers to add all types of the trendlines mentioned above by using Charts.ChartSeriesDataFormat.AddTrendLine() method and set the trendline type by using Charts.TrendlinesType enum.
Here comes to the detailed steps:
Step 1: Initialize a new instance of Presentation class and load the ppt file.
Presentation ppt = new Presentation();
ppt.LoadFromFile("Sample.pptx");
Step 2: Get the target chart, add trendline for the first data series of the chart and specify the trendline type.
IChart chart = ppt.Slides[0].Shapes[0] as IChart;
ITrendlines it = chart.Series[0].AddTrendLine(TrendlinesType.Linear);
//Set the trendline properties to determine what should be displayed.
it.displayEquation = false;
it.displayRSquaredValue = false;
Step 3: Save the file.
ppt.SaveToFile("output.pptx",FileFormat.Pptx2010);
Output:
Full codes:
using Spire.Presentation;
using Spire.Presentation.Charts;

namespace Add_trendline_for_chart_series
{
    class Program
    {
        static void Main(string[] args)
        {
            Presentation ppt = new Presentation();
            ppt.LoadFromFile("Sample.pptx");

            IChart chart = ppt.Slides[0].Shapes[0] as IChart;
            ITrendlines it = chart.Series[0].AddTrendLine(TrendlinesType.Linear);
            it.displayEquation = false;
            it.displayRSquaredValue = false;

            ppt.SaveToFile("output.pptx",FileFormat.Pptx2010);
        }
    }
}
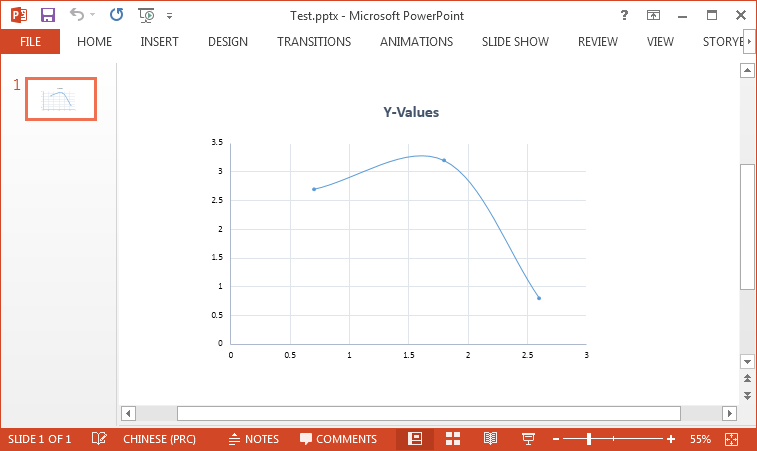
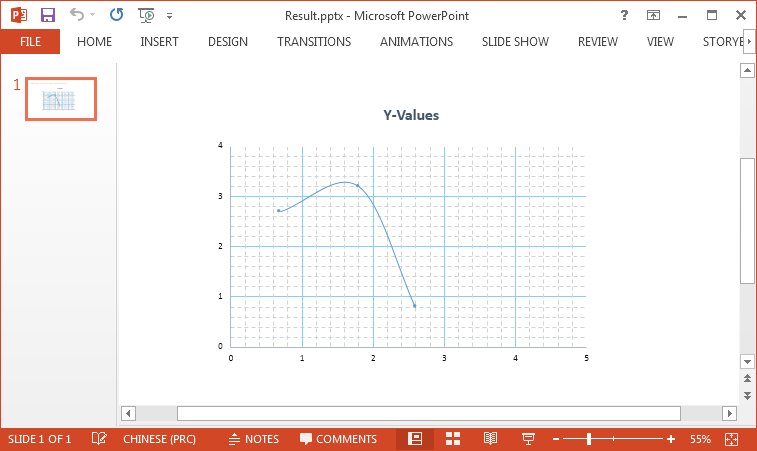
Axis is a significant part of charts. In order to make the data easier to read, we may need to modify the axis values or display the minor grid lines. This article demonstrates how to format axis of chart in PowerPoint using Spire.Presenation.
Here is the test document:
Code Snippet:
Step 1: Initialize a new instance of Presentation class and load a sample PowerPoint document.
Presentation ppt = new Presentation(@"C:\Users\Administrator\Desktop\Test.pptx", FileFormat.Pptx2010);
Step 2: Get the chart from the document.
IChart chart = ppt.Slides[0].Shapes[0] as IChart;
Step 3: Set bounds of axis value. Before we assign values, we must set IsAutoMax and IsAutoMin as false, otherwise MS PowerPoint will automatically set the values.
chart.PrimaryValueAxis.IsAutoMax = false;
chart.PrimaryValueAxis.IsAutoMin= false;
chart.SecondaryValueAxis.IsAutoMax = false;
chart.SecondaryValueAxis.IsAutoMin= false;
chart.PrimaryValueAxis.MinValue = 0f;
chart.PrimaryValueAxis.MaxValue = 5.0f;
chart.SecondaryValueAxis.MinValue = 0f;
chart.SecondaryValueAxis.MaxValue = 4.0f;
Step 4: For the same reason, IsAutoMajor and IsAutoMinor must be set as false before assigning values to MajorUnit and MinorUnit.
chart.PrimaryValueAxis.IsAutoMajor = false;
chart.PrimaryValueAxis.IsAutoMinor= false;
chart.SecondaryValueAxis.IsAutoMajor = false;
chart.SecondaryValueAxis.IsAutoMinor = false;
chart.PrimaryValueAxis.MajorUnit = 1.0f;
chart.PrimaryValueAxis.MinorUnit = 0.2f;
chart.SecondaryValueAxis.MajorUnit = 1.0f;
chart.SecondaryValueAxis.MinorUnit =0.2f;
Step 5: Set and format minor grid lines.
chart.PrimaryValueAxis.MinorGridLines.FillType = FillFormatType.Solid;
chart.SecondaryValueAxis.MinorGridLines.FillType = FillFormatType.Solid;
chart.PrimaryValueAxis.MinorGridLines.Width = 0.1f;
chart.SecondaryValueAxis.MinorGridLines.Width = 0.1f;
chart.PrimaryValueAxis.MinorGridLines.SolidFillColor.Color = Color.LightGray;
chart.SecondaryValueAxis.MinorGridLines.SolidFillColor.Color = Color.LightGray;
chart.PrimaryValueAxis.MinorGridLines.DashStyle = LineDashStyleType.Dash;
chart.SecondaryValueAxis.MinorGridLines.DashStyle = LineDashStyleType.Dash;
Step 6: Set and format major grid lines.
chart.PrimaryValueAxis.MajorGridTextLines.Width = 0.3f;
chart.PrimaryValueAxis.MajorGridTextLines.SolidFillColor.Color = Color.LightSkyBlue;
chart.SecondaryValueAxis.MajorGridTextLines.Width = 0.3f;
chart.SecondaryValueAxis.MajorGridTextLines.SolidFillColor.Color = Color.LightSkyBlue;
Step 7: Save the file.
ppt.SaveToFile("Result.pptx", FileFormat.Pptx2010);
Output:
Full Code:
using Spire.Presentation;
using Spire.Presentation.Charts;
using Spire.Presentation.Drawing;
using System.Drawing;

namespace FormatAxis
{
    class Program
    {
        static void Main(string[] args)
        {
            Presentation ppt = new Presentation(@"C:\Users\Administrator\Desktop\Test.pptx", FileFormat.Pptx2010);
            IChart chart = ppt.Slides[0].Shapes[0] as IChart;

            chart.PrimaryValueAxis.IsAutoMax = false;
            chart.PrimaryValueAxis.IsAutoMin = false;
            chart.SecondaryValueAxis.IsAutoMax = false;
            chart.SecondaryValueAxis.IsAutoMin = false;
            chart.PrimaryValueAxis.MinValue = 0f;
            chart.PrimaryValueAxis.MaxValue = 5.0f;
            chart.SecondaryValueAxis.MinValue = 0f;
            chart.SecondaryValueAxis.MaxValue = 4.0f;

            chart.PrimaryValueAxis.IsAutoMajor = false;
            chart.PrimaryValueAxis.IsAutoMinor = false;
            chart.SecondaryValueAxis.IsAutoMajor = false;
            chart.SecondaryValueAxis.IsAutoMinor = false;
            chart.PrimaryValueAxis.MajorUnit = 1.0f;
            chart.PrimaryValueAxis.MinorUnit = 0.2f;
            chart.SecondaryValueAxis.MajorUnit = 1.0f;
            chart.SecondaryValueAxis.MinorUnit = 0.2f;

            chart.PrimaryValueAxis.MinorGridLines.FillType = FillFormatType.Solid;
            chart.SecondaryValueAxis.MinorGridLines.FillType = FillFormatType.Solid;
            chart.PrimaryValueAxis.MinorGridLines.Width = 0.1f;
            chart.SecondaryValueAxis.MinorGridLines.Width = 0.1f;
            chart.PrimaryValueAxis.MinorGridLines.SolidFillColor.Color = Color.LightGray;
            chart.SecondaryValueAxis.MinorGridLines.SolidFillColor.Color = Color.LightGray;
            chart.PrimaryValueAxis.MinorGridLines.DashStyle = LineDashStyleType.Dash;
            chart.SecondaryValueAxis.MinorGridLines.DashStyle = LineDashStyleType.Dash;

            chart.PrimaryValueAxis.MajorGridTextLines.Width = 0.3f;
            chart.PrimaryValueAxis.MajorGridTextLines.SolidFillColor.Color = Color.LightSkyBlue;
            chart.SecondaryValueAxis.MajorGridTextLines.Width = 0.3f;
            chart.SecondaryValueAxis.MajorGridTextLines.SolidFillColor.Color = Color.LightSkyBlue;

            ppt.SaveToFile("Result.pptx", FileFormat.Pptx2010);
            System.Diagnostics.Process.Start("Result.pptx");

        }
    }
}
Imports Spire.Presentation
Imports Spire.Presentation.Charts
Imports Spire.Presentation.Drawing
Imports System.Drawing

Namespace FormatAxis
	Class Program
		Private Shared Sub Main(args As String())
			Dim ppt As New Presentation("C:\Users\Administrator\Desktop\Test.pptx", FileFormat.Pptx2010)
			Dim chart As IChart = TryCast(ppt.Slides(0).Shapes(0), IChart)

			chart.PrimaryValueAxis.IsAutoMax = False
			chart.PrimaryValueAxis.IsAutoMin = False
			chart.SecondaryValueAxis.IsAutoMax = False
			chart.SecondaryValueAxis.IsAutoMin = False
			chart.PrimaryValueAxis.MinValue = 0F
			chart.PrimaryValueAxis.MaxValue = 5F
			chart.SecondaryValueAxis.MinValue = 0F
			chart.SecondaryValueAxis.MaxValue = 4F

			chart.PrimaryValueAxis.IsAutoMajor = False
			chart.PrimaryValueAxis.IsAutoMinor = False
			chart.SecondaryValueAxis.IsAutoMajor = False
			chart.SecondaryValueAxis.IsAutoMinor = False
			chart.PrimaryValueAxis.MajorUnit = 1F
			chart.PrimaryValueAxis.MinorUnit = 0.2F
			chart.SecondaryValueAxis.MajorUnit = 1F
			chart.SecondaryValueAxis.MinorUnit = 0.2F

			chart.PrimaryValueAxis.MinorGridLines.FillType = FillFormatType.Solid
			chart.SecondaryValueAxis.MinorGridLines.FillType = FillFormatType.Solid
			chart.PrimaryValueAxis.MinorGridLines.Width = 0.1F
			chart.SecondaryValueAxis.MinorGridLines.Width = 0.1F
			chart.PrimaryValueAxis.MinorGridLines.SolidFillColor.Color = Color.LightGray
			chart.SecondaryValueAxis.MinorGridLines.SolidFillColor.Color = Color.LightGray
			chart.PrimaryValueAxis.MinorGridLines.DashStyle = LineDashStyleType.Dash
			chart.SecondaryValueAxis.MinorGridLines.DashStyle = LineDashStyleType.Dash

			chart.PrimaryValueAxis.MajorGridTextLines.Width = 0.3F
			chart.PrimaryValueAxis.MajorGridTextLines.SolidFillColor.Color = Color.LightSkyBlue
			chart.SecondaryValueAxis.MajorGridTextLines.Width = 0.3F
			chart.SecondaryValueAxis.MajorGridTextLines.SolidFillColor.Color = Color.LightSkyBlue

			ppt.SaveToFile("Result.pptx", FileFormat.Pptx2010)
			System.Diagnostics.Process.Start("Result.pptx")

		End Sub
	End Class
End Namespace
How to Create Bubble Chart in PowerPoint in C#, VB.NET
2015-06-30 08:47:01 Written by support iceblueA bubble chart is generally used to display the relationship between 3 parameters. For example, you can use bubble chart to show relation between Number of product, Sales volume and Market share. Unlike other charts, a bubble chart does not use a category axis - both horizontal and vertical axes are value axes.
As a powerful component, Spire.Presentation supports to insert various kinds of charts in PowerPoint including bubble chart. In this article, I made an example to show how to create bubble chart with custom data using Spire.Presentation in C#, VB.NET.
Main Steps:
Step 1: Initialize a new instance of Presentation class.
Presentation pres = new Presentation();
Step 2: Insert chart, set chart title and set the type of chart as Bubble.
RectangleF rect1 = new RectangleF(40, 40, 550, 320);
IChart chart = pres.Slides[0].Shapes.AppendChart(ChartType.Bubble, rect1, false);
chart.ChartTitle.TextProperties.Text = "Bubble Chart";
chart.ChartTitle.TextProperties.IsCentered = true;
chart.ChartTitle.Height = 30;
chart.HasTitle = true;
Step 3: Define a group of arrays.
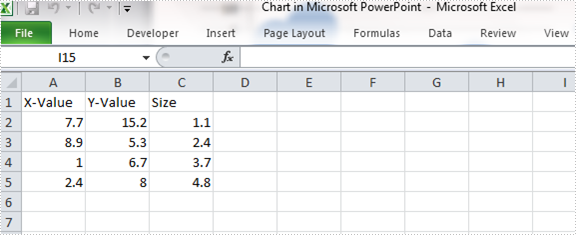
Double[] xdata = new Double[] { 7.7, 8.9, 1.0, 2.4 };
Double[] ydata = new Double[] { 15.2, 5.3, 6.7, 8 };
Double[] size = new Double[] { 1.1, 2.4, 3.7, 4.8 };
Step 4: Attach the data to chart. You can use the property chart.ChartData[rowIndex, columnIndex].Text to get/set the text value, use the property chart.ChartData[rowIndex, columnIndex].Value to get/set numeric value. Here I insert values in predefined arrays to the data chart.
chart.ChartData[0, 0].Text = "X-Value";
chart.ChartData[0, 1].Text = "Y-Value";
chart.ChartData[0, 2].Text = "Size";

for (Int32 i = 0; i < xdata.Length; ++i)
{
    chart.ChartData[i + 1, 0].Value = xdata[i];
    chart.ChartData[i + 1, 1].Value = ydata[i];
    chart.ChartData[i + 1, 2].Value = size[i];
}
Step 5: Set the Series label.
chart.Series.SeriesLabel = chart.ChartData["B1","B1"];
Step 6: Assign data to X axis, Y axis and Bubbles.
chart.Series[0].XValues = chart.ChartData["A2", "A5"];
chart.Series[0].YValues = chart.ChartData["B2", "B5"];
chart.Series[0].Bubbles.Add(chart.ChartData["C2"]);
chart.Series[0].Bubbles.Add(chart.ChartData["C3"]);
chart.Series[0].Bubbles.Add(chart.ChartData["C4"]);
chart.Series[0].Bubbles.Add(chart.ChartData["C5"]);
Step 7: Save and launch the file.
pres.SaveToFile(@"result.pptx", FileFormat.Pptx2010);
System.Diagnostics.Process.Start("result.pptx");
Output:
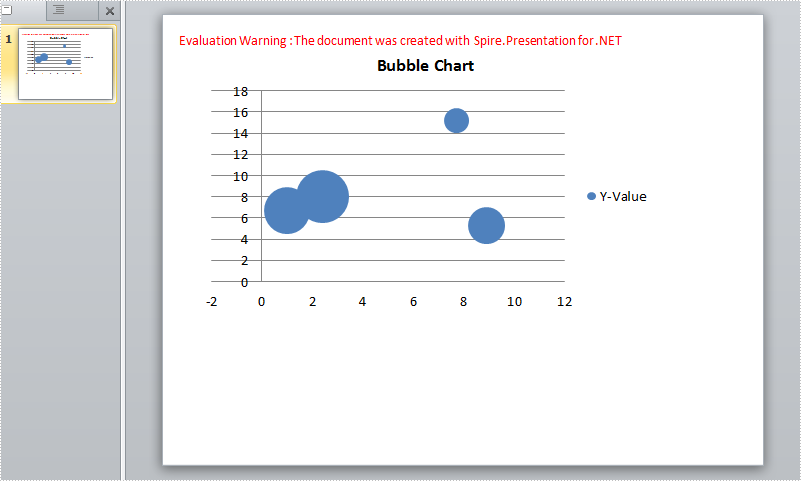
Chart data:
Full Code:
using Spire.Presentation;
using Spire.Presentation.Charts;
using System;
using System.Drawing;

     namespace CreateBubbleChart
{
    class Program
    {
        static void Main(string[] args)
        {
            Presentation pres = new Presentation();
            RectangleF rect1 = new RectangleF(40, 40, 550, 320);
            IChart chart = pres.Slides[0].Shapes.AppendChart(ChartType.Bubble, rect1, false);
            chart.ChartTitle.TextProperties.Text = "Bubble Chart";
            chart.ChartTitle.TextProperties.IsCentered = true;
            chart.ChartTitle.Height = 30;
            chart.HasTitle = true;

            Double[] xdata = new Double[] { 7.7, 8.9, 1.0, 2.4 };
            Double[] ydata = new Double[] { 15.2, 5.3, 6.7, 8 };
            Double[] size = new Double[] { 1.1, 2.4, 3.7, 4.8 };

            chart.ChartData[0, 0].Text = "X-Value";
            chart.ChartData[0, 1].Text = "Y-Value";
            chart.ChartData[0, 2].Text = "Size";

            for (Int32 i = 0; i < xdata.Length; ++i)
            {
                chart.ChartData[i + 1, 0].Value = xdata[i];
                chart.ChartData[i + 1, 1].Value = ydata[i];
                chart.ChartData[i + 1, 2].Value = size[i];
            }

            chart.Series.SeriesLabel = chart.ChartData["B1", "B1"];

            chart.Series[0].XValues = chart.ChartData["A2", "A5"];
            chart.Series[0].YValues = chart.ChartData["B2", "B5"];
            chart.Series[0].Bubbles.Add(chart.ChartData["C2"]);
            chart.Series[0].Bubbles.Add(chart.ChartData["C3"]);
            chart.Series[0].Bubbles.Add(chart.ChartData["C4"]);
            chart.Series[0].Bubbles.Add(chart.ChartData["C5"]);

            pres.SaveToFile(@"result.pptx", FileFormat.Pptx2010);
            System.Diagnostics.Process.Start("result.pptx");

        }
    }
}
Imports Spire.Presentation
Imports Spire.Presentation.Charts
Imports System.Drawing

Namespace CreateBubbleChart
	Class Program
		Private Shared Sub Main(args As String())
			Dim pres As New Presentation()
			Dim rect1 As New RectangleF(40, 40, 550, 320)
			Dim chart As IChart = pres.Slides(0).Shapes.AppendChart(ChartType.Bubble, rect1, False)
			chart.ChartTitle.TextProperties.Text = "Bubble Chart"
			chart.ChartTitle.TextProperties.IsCentered = True
			chart.ChartTitle.Height = 30
			chart.HasTitle = True

			Dim xdata As [Double]() = New [Double]() {7.7, 8.9, 1.0, 2.4}
			Dim ydata As [Double]() = New [Double]() {15.2, 5.3, 6.7, 8}
			Dim size As [Double]() = New [Double]() {1.1, 2.4, 3.7, 4.8}

			chart.ChartData(0, 0).Text = "X-Value"
			chart.ChartData(0, 1).Text = "Y-Value"
			chart.ChartData(0, 2).Text = "Size"

			For i As Int32 = 0 To xdata.Length - 1
				chart.ChartData(i + 1, 0).Value = xdata(i)
				chart.ChartData(i + 1, 1).Value = ydata(i)
				chart.ChartData(i + 1, 2).Value = size(i)
			Next

			chart.Series.SeriesLabel = chart.ChartData("B1", "B1")

			chart.Series(0).XValues = chart.ChartData("A2", "A5")
			chart.Series(0).YValues = chart.ChartData("B2", "B5")
			chart.Series(0).Bubbles.Add(chart.ChartData("C2"))
			chart.Series(0).Bubbles.Add(chart.ChartData("C3"))
			chart.Series(0).Bubbles.Add(chart.ChartData("C4"))
			chart.Series(0).Bubbles.Add(chart.ChartData("C5"))

			pres.SaveToFile("result.pptx", FileFormat.Pptx2010)
			System.Diagnostics.Process.Start("result.pptx")

		End Sub
	End Class
End Namespace
