Trendline
A trendline is a line superimposed on a chart revealing the overall direction of the data. There are six different types of trendlines:
- linear
- logarithmic
- polynomial
- power
- exponential
- moving average
Add trendline for chart series
Spire.Presentation enables developers to add all types of the trendlines mentioned above by using Charts.ChartSeriesDataFormat.AddTrendLine() method and set the trendline type by using Charts.TrendlinesType enum.
Here comes to the detailed steps:
Step 1: Initialize a new instance of Presentation class and load the ppt file.
Presentation ppt = new Presentation();
ppt.LoadFromFile("Sample.pptx");
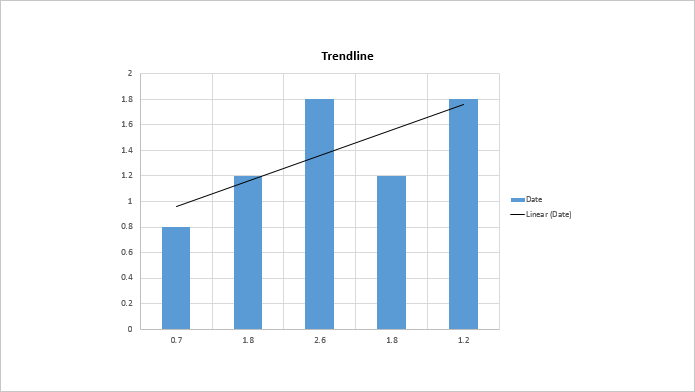
Step 2: Get the target chart, add trendline for the first data series of the chart and specify the trendline type.
IChart chart = ppt.Slides[0].Shapes[0] as IChart;
ITrendlines it = chart.Series[0].AddTrendLine(TrendlinesType.Linear);
//Set the trendline properties to determine what should be displayed.
it.displayEquation = false;
it.displayRSquaredValue = false;
Step 3: Save the file.
ppt.SaveToFile("output.pptx",FileFormat.Pptx2010);
Output:

Full codes:
using Spire.Presentation;
using Spire.Presentation.Charts;

namespace Add_trendline_for_chart_series
{
    class Program
    {
        static void Main(string[] args)
        {
            Presentation ppt = new Presentation();
            ppt.LoadFromFile("Sample.pptx");

            IChart chart = ppt.Slides[0].Shapes[0] as IChart;
            ITrendlines it = chart.Series[0].AddTrendLine(TrendlinesType.Linear);
            it.displayEquation = false;
            it.displayRSquaredValue = false;

            ppt.SaveToFile("output.pptx",FileFormat.Pptx2010);
        }
    }
}


