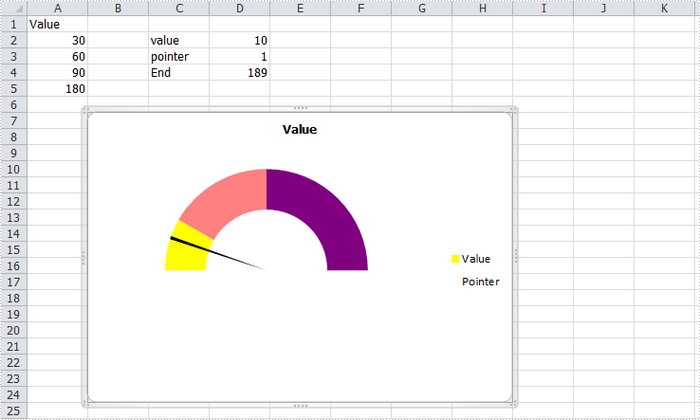
A gauge chart (or speedometer chart) is a combination of doughnut chart and pie chart. It only displays a single value which is used to indicate how far you are from reaching a goal. In this article, you'll learn how to create a gauge chart in C# via Spire.XLS.
Here is the gauge chart that I'm going to create.

Code Snippet:
Step 1: Create a new workbook and add some sample data into the first sheet.
Workbook book = new Workbook();
Worksheet sheet = book.Worksheets[0];
sheet.Range["A1"].Value = "Value";
sheet.Range["A2"].Value = "30";
sheet.Range["A3"].Value = "60";
sheet.Range["A4"].Value = "90";
sheet.Range["A5"].Value = "180";
sheet.Range["C2"].Value = "value";
sheet.Range["C3"].Value = "pointer";
sheet.Range["C4"].Value = "End";
sheet.Range["D2"].Value = "10";
sheet.Range["D3"].Value = "1";
sheet.Range["D4"].Value = "189";
Step 2: Create a doughnut chart based on the data from A1 to A5. Set the chart position.
Chart chart = sheet.Charts.Add(ExcelChartType.Doughnut);
chart.DataRange = sheet.Range["A1:A5"];
chart.SeriesDataFromRange = false;
chart.HasLegend = true;
chart.LeftColumn = 2;
chart.TopRow = 7;
chart.RightColumn = 9;
chart.BottomRow = 25;
Step 3: Set format of Value series. Following code makes the graphic looks like a semi-circle.
var cs1 = (ChartSerie)chart.Series["Value"];
cs1.Format.Options.DoughnutHoleSize = 60;
cs1.DataFormat.Options.FirstSliceAngle = 270;
cs1.DataPoints[0].DataFormat.Fill.ForeColor = Color.Yellow;
cs1.DataPoints[1].DataFormat.Fill.ForeColor = Color.PaleVioletRed;
cs1.DataPoints[2].DataFormat.Fill.ForeColor = Color.DarkViolet;
cs1.DataPoints[3].DataFormat.Fill.Visible = false;
Step 4: Add a new series to the doughnut chart, set chart type as Pie, and set the data range for the series. Format the each data point in the series to make sure only the pointer category is visible in the graphic.
var cs2 = (ChartSerie)chart.Series.Add("Pointer", ExcelChartType.Pie);
cs2.Values = sheet.Range["D2:D4"];
cs2.UsePrimaryAxis = false;
cs2.DataPoints[0].DataLabels.HasValue= true;
cs2.DataFormat.Options.FirstSliceAngle = 270;
cs2.DataPoints[0].DataFormat.Fill.Visible = false;
cs2.DataPoints[1].DataFormat.Fill.FillType = ShapeFillType.SolidColor;
cs2.DataPoints[1].DataFormat.Fill.ForeColor = Color.Black;
cs2.DataPoints[2].DataFormat.Fill.Visible = false;
Step 5: Save and launch to view the effect.
book.SaveToFile("AddGaugeChart.xlsx", FileFormat.Version2010);
System.Diagnostics.Process.Start("AddGaugeChart.xlsx");
Full Code:
using Spire.Xls;
using Spire.Xls.Charts;
using System.Drawing;
namespace CreateGauge
{
    class Program
    {

        static void Main(string[] args)
        {
            Workbook book = new Workbook();
            Worksheet sheet = book.Worksheets[0];
            sheet.Range["A1"].Value = "Value";
            sheet.Range["A2"].Value = "30";
            sheet.Range["A3"].Value = "60";
            sheet.Range["A4"].Value = "90";
            sheet.Range["A5"].Value = "180";
            sheet.Range["C2"].Value = "value";
            sheet.Range["C3"].Value = "pointer";
            sheet.Range["C4"].Value = "End";
            sheet.Range["D2"].Value = "10";
            sheet.Range["D3"].Value = "1";
            sheet.Range["D4"].Value = "189";

            Chart chart = sheet.Charts.Add(ExcelChartType.Doughnut);
            chart.DataRange = sheet.Range["A1:A5"];
            chart.SeriesDataFromRange = false;
            chart.HasLegend = true;
            chart.LeftColumn = 2;
            chart.TopRow = 7;
            chart.RightColumn = 9;
            chart.BottomRow = 25;

            var cs1 = (ChartSerie)chart.Series["Value"];
            cs1.Format.Options.DoughnutHoleSize = 60;
            cs1.DataFormat.Options.FirstSliceAngle = 270;
            cs1.DataPoints[0].DataFormat.Fill.ForeColor = Color.Yellow;
            cs1.DataPoints[1].DataFormat.Fill.ForeColor = Color.PaleVioletRed;
            cs1.DataPoints[2].DataFormat.Fill.ForeColor = Color.DarkViolet;
            cs1.DataPoints[3].DataFormat.Fill.Visible = false;

            var cs2 = (ChartSerie)chart.Series.Add("Pointer", ExcelChartType.Pie);
            cs2.Values = sheet.Range["D2:D4"];
            cs2.UsePrimaryAxis = false;
            cs2.DataPoints[0].DataLabels.HasValue = true;
            cs2.DataFormat.Options.FirstSliceAngle = 270;
            cs2.DataPoints[0].DataFormat.Fill.Visible = false;
            cs2.DataPoints[1].DataFormat.Fill.FillType = ShapeFillType.SolidColor;
            cs2.DataPoints[1].DataFormat.Fill.ForeColor = Color.Black;
            cs2.DataPoints[2].DataFormat.Fill.Visible = false;

            book.SaveToFile("AddGaugeChart.xlsx", FileFormat.Version2010);
            System.Diagnostics.Process.Start("AddGaugeChart.xlsx");

        }
    }
}

