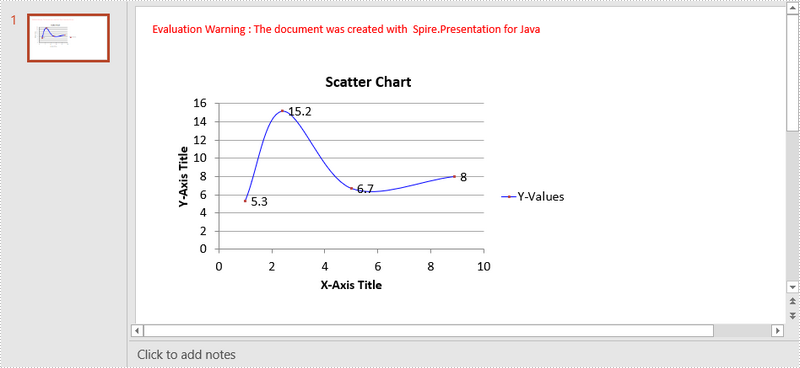
A scatter (XY) chart is a two-dimensional chart that shows the relationship between two sets of variables. Each scatter chart has two axes: a horizontal axis (x-axis) and a vertical axis (y-axis), and it accepts only one data series. In this article, you will learn how to add a scatter chart to a PowerPoint slide using Spire.Presentation for Java.
Install Spire.Presentation for Java
First of all, you're required to add the Spire.Presentation.jar file as a dependency in your Java program. The JAR file can be downloaded from this link. If you use Maven, you can easily import the JAR file in your application by adding the following code to your project's pom.xml file.
<repositories>
    <repository>
        <id>com.e-iceblue</id>
        <name>e-iceblue</name>
        <url>https://repo.e-iceblue.com/nexus/content/groups/public/</url>
    </repository>
</repositories>
<dependencies>
    <dependency>
        <groupId>e-iceblue</groupId>
        <artifactId>spire.presentation</artifactId>
        <version>9.10.2</version>
    </dependency>
</dependencies>
Create a Scatter Chart in PowerPoint
Spire.Presentation for Java provides the ShapeCollection.appendChart(ChartType type, Rectangle2D rectangle, boolean init) method to add charts of a certain type to a presentation slide. The ChartType enumeration pre-defines 73 chart types, including scatter chart, column chart, pie chart, etc. The following are the main steps to add a scatter chart in PowerPoint.
- Create a Presentation object.
- Append a scatter chart to the specific slide using ShapeCollection.appendChart() method.
- Set the chart data through ChartData.get().setValue() method.
- Set the chart title, axes titles, series labels, etc. using the methods under IChart interface.
- Set the grid line style and data point line style.
- Save the document to file using Presentation.saveToFile() method.
- Java
import com.spire.presentation.FileFormat;
import com.spire.presentation.Presentation;
import com.spire.presentation.SlideSizeType;
import com.spire.presentation.TextLineStyle;
import com.spire.presentation.charts.ChartType;
import com.spire.presentation.charts.IChart;
import com.spire.presentation.charts.entity.ChartDataLabel;
import com.spire.presentation.drawing.FillFormatType;

import java.awt.*;
import java.awt.geom.Rectangle2D;

public class CreateScatterChart {

    public static void main(String[] args) throws Exception {

        //Create a Presentation object
        Presentation presentation = new Presentation();
        presentation.getSlideSize().setType(SlideSizeType.SCREEN_16_X_9);

        //Add a scatter chart to the first slide
        IChart chart = presentation.getSlides().get(0).getShapes().appendChart(ChartType.SCATTER_SMOOTH_LINES_AND_MARKERS,new Rectangle2D.Float(40, 80, 550, 320),false);

        //Set the chart title
        chart.getChartTitle().getTextProperties().setText("Scatter Chart");
        chart.getChartTitle().getTextProperties().isCentered(true);
        chart.getChartTitle().setHeight(20f);
        chart.hasTitle(true);

        //Set the chart data
        Double[] xData = new Double[] { 1.0, 2.4, 5.0, 8.9 };
        Double[] yData = new Double[] { 5.3, 15.2, 6.7, 8.0 };
        chart.getChartData().get(0,0).setText("X-Values");
        chart.getChartData().get(0,1).setText("Y-Values");
        for (int i = 0; i < xData.length; i++) {
            chart.getChartData().get(i+1,0).setValue(xData[i]);
            chart.getChartData().get(i+1,1).setValue(yData[i]);
        }

        //Set the series label
        chart.getSeries().setSeriesLabel(chart.getChartData().get("B1","B1"));

        //Set the X and Y values
        chart.getSeries().get(0).setXValues(chart.getChartData().get("A2","A5"));
        chart.getSeries().get(0).setYValues(chart.getChartData().get("B2","B5"));

        //Add data labels
        for (int i = 0; i < 4; i++)
        {
            ChartDataLabel dataLabel = chart.getSeries().get(0).getDataLabels().add();
            dataLabel.setLabelValueVisible(true);
        }

        //Set the primary axis title and the secondary axis title
        chart.getPrimaryValueAxis().hasTitle(true);
        chart.getPrimaryValueAxis().getTitle().getTextProperties().setText("X-Axis Title");
        chart.getSecondaryValueAxis().hasTitle(true);
        chart.getSecondaryValueAxis().getTitle().getTextProperties().setText("Y-Axis Title");

        //Set the grid line
        chart.getSecondaryValueAxis().getMajorGridTextLines().setFillType(FillFormatType.SOLID);
        chart.getSecondaryValueAxis().getMajorGridTextLines().setStyle(TextLineStyle.THIN_THIN);
        chart.getSecondaryValueAxis().getMajorGridTextLines().getSolidFillColor().setColor(Color.GRAY);
        chart.getPrimaryValueAxis().getMajorGridTextLines().setFillType(FillFormatType.NONE);

        //Set the data point line
        chart.getSeries().get(0).getLine().setFillType(FillFormatType.SOLID);
        chart.getSeries().get(0).getLine().setWidth(0.1f);
        chart.getSeries().get(0).getLine().getSolidFillColor().setColor(Color.BLUE);

        //Save the document to file
        presentation.saveToFile("output/ScatterChart.pptx", FileFormat.PPTX_2016);
    }
}

Apply for a Temporary License
If you'd like to remove the evaluation message from the generated documents, or to get rid of the function limitations, please request a 30-day trial license for yourself.

