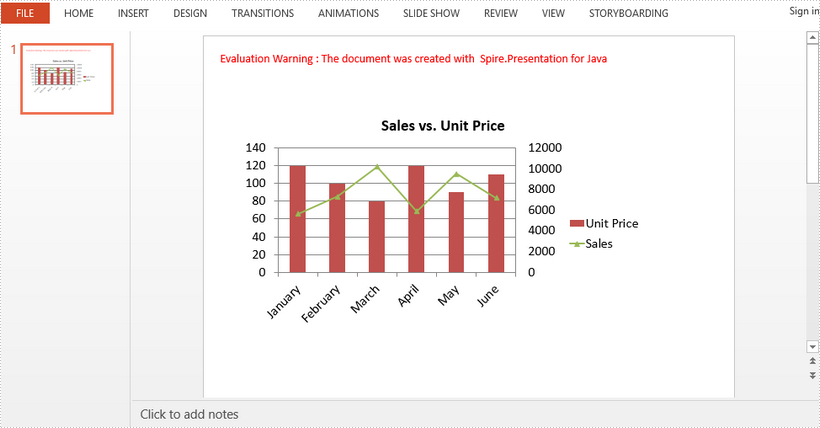
A combination chart is a chart that combines at least two chart types in a single chart. This article introduces how to combine clustered column and line chart in PowerPoint using Spire.Presentation for Java.
import com.spire.presentation.FileFormat;
import com.spire.presentation.Presentation;
import com.spire.presentation.charts.ChartType;
import com.spire.presentation.charts.IChart;
import com.spire.presentation.drawing.FillFormatType;

import java.awt.geom.Rectangle2D;

public class CombinationChart {

    public static void main(String[] args) throws Exception {

        //create a PowerPoint document
        Presentation presentation = new Presentation();

        //insert a column clustered chart
        Rectangle2D.Double rect = new   Rectangle2D.Double(50, 100, 550, 300);
        IChart chart = presentation.getSlides().get(0).getShapes().appendChart(ChartType.COLUMN_CLUSTERED, rect);

        //set chart title
        chart.getChartTitle().getTextProperties().setText("Sales vs. Unit Price");
        chart.getChartTitle().getTextProperties().isCentered(true);
        chart.getChartTitle().setHeight(30);
        chart.hasTitle(true);

        //write data to chart as chart data
        chart.getChartData().get(0,0).setText("Month");
        chart.getChartData().get(0,1).setText("Unit Price");
        chart.getChartData().get(0,2).setText("Sales");
        chart.getChartData().get(1,0).setText("January");
        chart.getChartData().get(1,1).setNumberValue(120);
        chart.getChartData().get(1,2).setNumberValue(5600);
        chart.getChartData().get(2,0).setText("February");
        chart.getChartData().get(2,1).setNumberValue(100);
        chart.getChartData().get(2,2).setNumberValue(7300);
        chart.getChartData().get(3,0).setText("March");
        chart.getChartData().get(3,1).setNumberValue(80);
        chart.getChartData().get(3,2).setNumberValue(10200);
        chart.getChartData().get(4,0).setText("April");
        chart.getChartData().get(4,1).setNumberValue(120);
        chart.getChartData().get(4,2).setNumberValue(5900);
        chart.getChartData().get(5,0).setText("May");
        chart.getChartData().get(5,1).setNumberValue(90);
        chart.getChartData().get(5,2).setNumberValue(9500);
        chart.getChartData().get(6,0).setText("June");
        chart.getChartData().get(6,1).setNumberValue(110);
        chart.getChartData().get(6,2).setNumberValue(7200);

        //set series labels
        chart.getSeries().setSeriesLabel(chart.getChartData().get("B1", "C1"));

        //set categories labels
        chart.getCategories().setCategoryLabels(chart.getChartData().get("A2", "A7"));

        //assign data to series values
        chart.getSeries().get(0).setValues(chart.getChartData().get("B2", "B7"));
        chart.getSeries().get(1).setValues(chart.getChartData().get("C2", "C7"));

        //change the chart type of series 2 to line with markers
        chart.getSeries().get(1).setType(ChartType.LINE_MARKERS);

        //plot data of series 2 on the secondary axis
        chart.getSeries().get(1).setUseSecondAxis(true);

        //hide grid links of secondary axis
        chart.getSecondaryValueAxis().getMajorGridTextLines().setFillType(FillFormatType.NONE);

        //set overlap
        chart.setOverLap(-50);

        //set gap width
        chart.setGapDepth(200);

        //save the document
        presentation.saveToFile("CombinationChart.pptx", FileFormat.PPTX_2010);
    }
}


