
We always use chart in Excel documents to make the data more clear and visible. With the help of Spire.XLS, developers can easily create different kinds of charts, such as Pie chart, column chart, bar chart, radar chart and so on. This article will focus on demonstrate how to create Excel pie chart on WPF applications.
Note: Before Start, please download the latest version of Spire.XLS and add Spire.Xls.Wpf.dll in the bin folder as the reference of Visual Studio.
Here comes to the code snippets of how to create Excel pie chart:
Step 1: Create a new Excel workbook and load from file.
Workbook workbook = new Workbook();
workbook.LoadFromFile("Sample.xlsx");
Step 2: Get the first worksheet from workbook.
Worksheet sheet = workbook.Worksheets[0];
Step 3: Add Chart and set chart type.
Chart chart = sheet.Charts.Add(ExcelChartType.Pie);
Step 4: Set chart data range.
chart.DataRange = sheet.Range["B2:B8"];
chart.SeriesDataFromRange = false;
Step 5: Set the position, border, title and legend for the chart.
//Chart Position
chart.LeftColumn = 1;
chart.TopRow =12;
chart.RightColumn = 8;
chart.BottomRow = 26;

//Chart Border
chart.ChartArea.Border.Weight = ChartLineWeightType.Medium;
chart.ChartArea.Border.Color = System.Drawing.Color.SandyBrown;

//Chart Title
chart.ChartTitle = "Parts Sales Info";
chart.ChartTitleArea.Font.FontName = "Calibri";
chart.ChartTitleArea.Font.Size = 10;
chart.ChartTitleArea.Font.IsBold = true;

//Chart Legend
chart.Legend.Position = LegendPositionType.Right;
Step 6: Save the document to file and launch to preview it.
workbook.SaveToFile("ExcelPieChart.xlsx", ExcelVersion.Version2010);
System.Diagnostics.Process.Start("ExcelPieChart.xlsx");
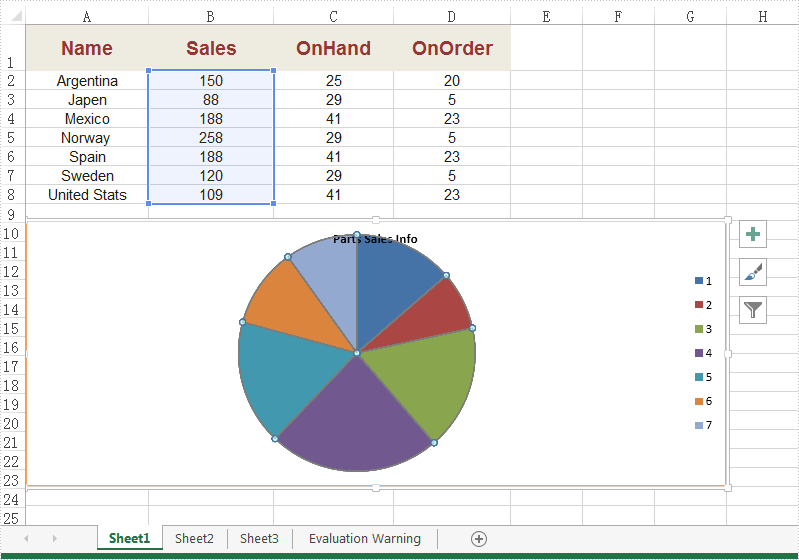
Effective screenshot of the generated pie chart by Spire.XLS for WPF:
Full codes:
using Spire.Xls;
using System.Windows;

namespace WpfApplication1
{
    public partial class MainWindow : Window
    {
        public MainWindow()
        {
            InitializeComponent();
        }
        private void button2_Click(object sender, RoutedEventArgs e)
        {
            Workbook workbook = new Workbook();
            workbook.LoadFromFile("Sample.xlsx");
            Worksheet sheet = workbook.Worksheets[0];

            Chart chart = sheet.Charts.Add(ExcelChartType.Pie);

            chart.DataRange = sheet.Range["B2:B8"];
            chart.SeriesDataFromRange = false;

            chart.LeftColumn = 1;
            chart.TopRow = 12;
            chart.RightColumn = 8;
            chart.BottomRow = 26;

            chart.ChartArea.Border.Weight = ChartLineWeightType.Medium;
            chart.ChartArea.Border.Color = System.Drawing.Color.SandyBrown;

            chart.ChartTitle = "Parts Sales Info";
            chart.ChartTitleArea.Font.FontName = "Calibri";
            chart.ChartTitleArea.Font.Size = 10;
            chart.ChartTitleArea.Font.IsBold = true;

            chart.Legend.Position = LegendPositionType.Right;

            workbook.SaveToFile("ExcelPieChart.xlsx", ExcelVersion.Version2010);
            System.Diagnostics.Process.Start("ExcelPieChart.xlsx");
        }
    }
}
