
Gridlines in Microsoft Excel provide a visual aid that helps users navigate through data and maintain a structured layout. By default, Excel displays gridlines in a light color to separate cells, making it easier to distinguish and locate specific data. However, there are instances when you may want to hide or even modify the appearance of gridlines to suit your specific needs. In this article, we will explore how to hide, show, and change gridlines in Excel in Python using Spire.XLS for Python.
Install Spire.XLS for Python
This scenario requires Spire.XLS for Python and plum-dispatch v1.7.4. They can be easily installed in your Windows through the following pip command.
pip install Spire.XLS
If you are unsure how to install, please refer to this tutorial: How to Install Spire.XLS for Python on Windows
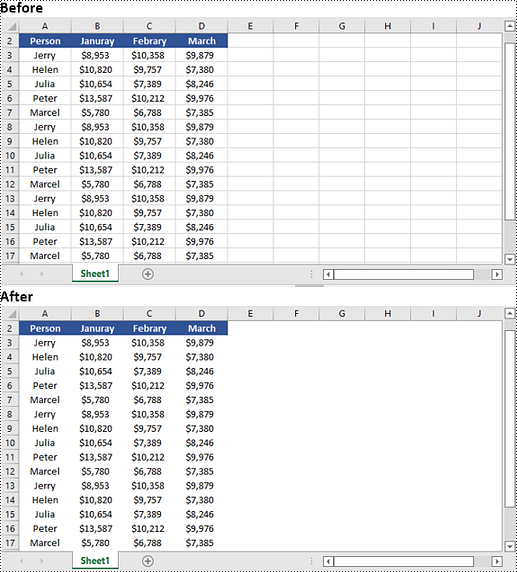
Hide or Show Gridlines in Excel in Python
The Worksheet.GridLinesVisible property provided by Spire.XLS for Python is used to control the visibility of gridlines in an Excel worksheet. If you want to hide the gridlines in the worksheet, set this property to False. Conversely, if you wish to make the hidden gridlines visible again, set this property to True. The detailed steps are as follows.
- Create an object of the Workbook class.
- Load an Excel file using the Workbook.LoadFromFile() method.
- Get a specific worksheet by its index using the Workbook.Worksheets[index] property.
- Hide or show the gridlines in the worksheet by setting the Worksheet.GridLinesVisible property as False or True.
- Save the result file using the Workbook.SaveToFile() method.
- Python
from spire.xls import *
from spire.xls.common import *

# Create a Workbook object
workbook = Workbook()
# Load an Excel file
workbook.LoadFromFile("Input.xlsx")

# Get the first worksheet
sheet = workbook.Worksheets[0]

# Hide the gridlines in the worksheet
sheet.GridLinesVisible = False

# Show the hidden gridlines in the worksheet
# sheet.GridLinesVisible = True

# Save the result file
workbook.SaveToFile("HideGridlines.xlsx", ExcelVersion.Version2016)

workbook.Dispose()
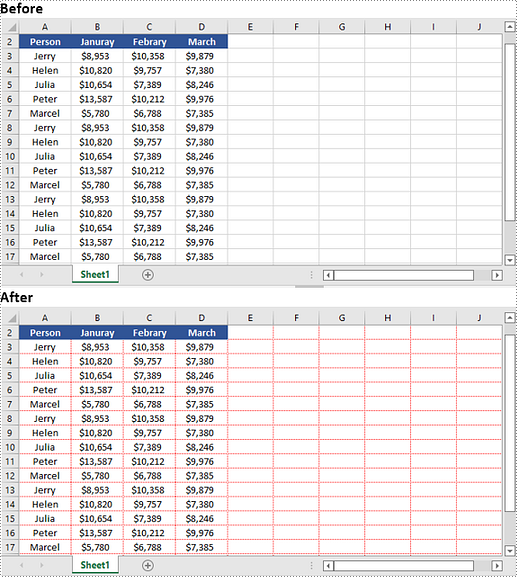
Change Gridlines in Excel in Python
Spire.XLS for Python provides the Worksheet.GridLineColor property, which allows you to customize the color of gridlines in an Excel worksheet. By using this property, you can change the default color of gridlines to your desired choice. The detailed steps are as follows.
- Create an object of the Workbook class.
- Load an Excel file using the Workbook.LoadFromFile() method.
- Get a specific worksheet by its index using the Workbook.Worksheets[index] property.
- Change the color of the gridlines in the worksheet using the Worksheet.GridLineColor property.
- Save the result file using the Workbook.SaveToFile() method.
- Python
from spire.xls import *
from spire.xls.common import *

# Create a Workbook object
workbook = Workbook()
# Load an Excel file
workbook.LoadFromFile("Input.xlsx")

# Get the first worksheet
sheet = workbook.Worksheets[0]

# Change the color of the gridlines in the worksheet
sheet.GridLineColor = ExcelColors.Red

# Save the result file
workbook.SaveToFile("ChangeGridlineColor.xlsx", ExcelVersion.Version2016)

workbook.Dispose()
Apply for a Temporary License
If you'd like to remove the evaluation message from the generated documents, or to get rid of the function limitations, please request a 30-day trial license for yourself.
