
SVG (Scalable Vector Graphics) is a flexible file format widely used on the web. Unlike traditional image formats, SVG files are not based on pixels. Instead, they use mathematical equations to define shapes, lines, and colors. This unique characteristic allows SVG files to be scaled up or down without any loss of quality, making them an excellent choice for creating interactive and visually appealing graphics. By converting Excel files to SVG, you can seamlessly embed the resulting SVG files into web pages, ensuring smooth integration and display of your Excel data on the web. In this article, we will demonstrate how to convert Excel to SVG format in Python using Spire.XLS for Python.
Install Spire.XLS for Python
This scenario requires Spire.XLS for Python and plum-dispatch v1.7.4. They can be easily installed in your Windows through the following pip command.
pip install Spire.XLS
If you are unsure how to install, please refer to this tutorial: How to Install Spire.XLS for Python on Windows
Convert a Worksheet in Excel to SVG in Python
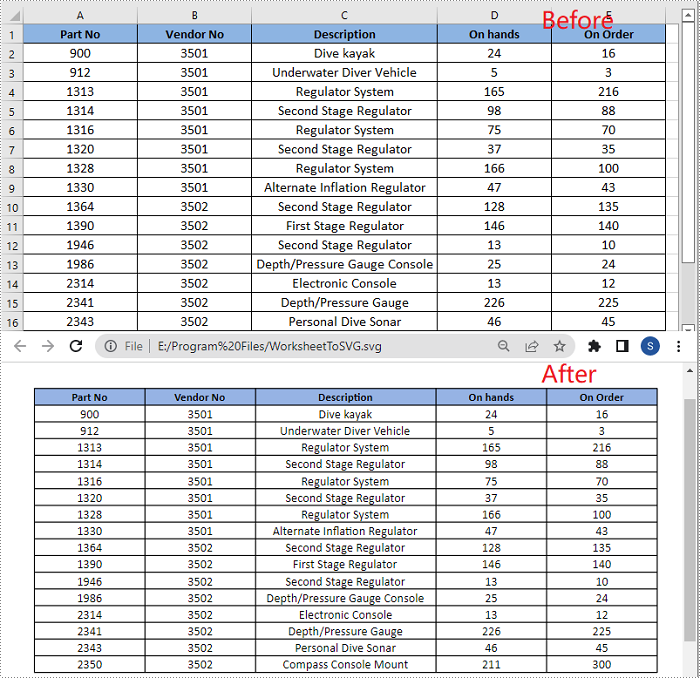
Spire.XLS for Python provides the Worksheet.ToSVGStream() method to convert an Excel worksheet to SVG. The detailed steps are as follows:
- Create an object of the Workbook class.
- Load an Excel file using Workbook.LoadFromFile() method.
- Get a specific worksheet by its index through Workbook.Worksheets[] property.
- Create an object of the Stream class.
- Save the worksheet to an SVG using Worksheet.ToSVGStream() method.
- Python
from spire.xls.common import *
from spire.xls import *

# Create a Workbook object
workbook = Workbook()
# Load an Excel file
workbook.LoadFromFile("Sample1.xlsx")

# Get the first worksheet
worksheet = workbook.Worksheets[0]

# Save the worksheet to an SVG
stream = Stream("WorksheetToSVG.svg")
worksheet.ToSVGStream(stream, 0, 0, 0, 0)
stream.Flush()
stream.Close()

workbook.Dispose()
Convert a Chart Sheet in Excel to SVG in Python
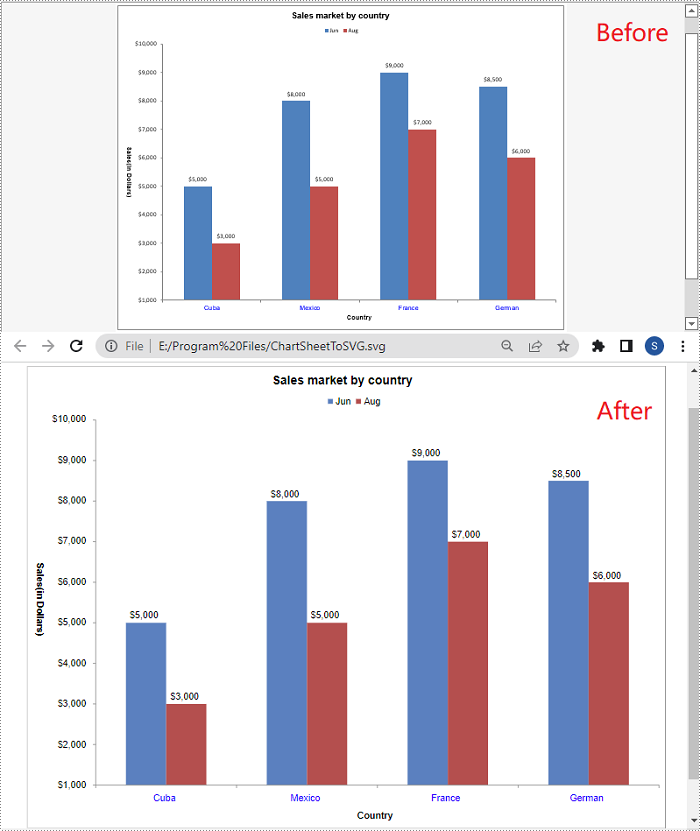
A chart sheet in Excel is a separate sheet within an Excel workbook that is dedicated to displaying a chart. Spire.XLS for Python allows you to convert a chart sheet to SVG by using the ChartSheet.ToSVGStream() method. The detailed steps are as follows:
- Create an object of the Workbook class.
- Load an Excel file using Workbook.LoadFromFile() method.
- Get a specific chart sheet using Workbook.GetChartSheetByName() method.
- Create an object of the Stream class.
- Save the chart sheet to an SVG using ChartSheet.ToSVGStream() method.
- Python
from spire.xls.common import *
from spire.xls import *

# Create a Workbook object
workbook = Workbook()
# Load an Excel file
workbook.LoadFromFile("Sample2.xlsx")

# Get a specific chart sheet
chartSheet = workbook.GetChartSheetByName("Chart1")

# Save the chart sheet to an SVG
stream = Stream("ChartSheetToSVG.svg")
chartSheet.ToSVGStream(stream)
stream.Flush()
stream.Close()

workbook.Dispose()
Apply for a Temporary License
If you'd like to remove the evaluation message from the generated documents, or to get rid of the function limitations, please request a 30-day trial license for yourself.
