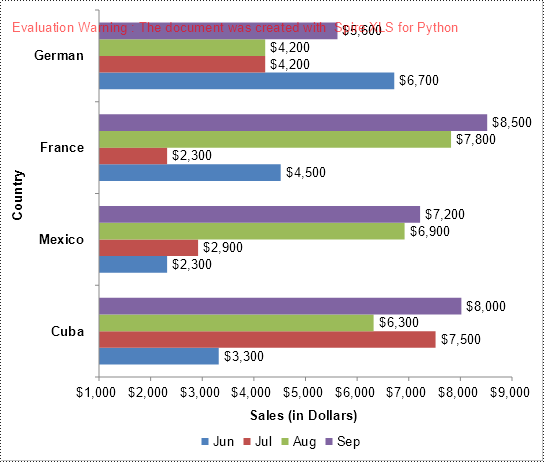
Charts and shapes in Excel are vital tools for clear and effective data presentation. Sometimes, it's beneficial to convert these visual elements into images. Perhaps you need to include a specific chart in a report or presentation outside of Excel. Or maybe you want to use an Excel-created infographic on your company's website. Regardless of the use case, knowing how to export these visuals as standalone image files can be invaluable. In this guide, we will explore how to convert charts and shapes in Excel to images in Python using Spire.XLS for Python.
- Convert a Specific Chart in an Excel Worksheet to Image in Python
- Convert All Charts in an Excel Worksheet to Images in Python
- Convert a Chart Sheet in Excel to Image in Python
- Convert Shapes in Excel to Images in Python
Install Spire.XLS for Python
This scenario requires Spire.XLS for Python and plum-dispatch v1.7.4. They can be easily installed in your Windows through the following pip command.
pip install Spire.XLS
If you are unsure how to install, please refer to this tutorial: How to Install Spire.XLS for Python on Windows
Convert a Specific Chart in an Excel Worksheet to Image in Python
Spire.XLS for Python offers the Workbook.SaveChartAsImage(worksheet: Worksheet, chartIndex: int) method, allowing you to convert a specific chart within a worksheet into an image stream. This image stream can then be saved as an image file in various formats, including PNG, JPG, BMP, and more. The detailed steps are as follows.
- Create an object of the Workbook class.
- Load an Excel file using the Workbook.LoadFromFile() method.
- Get a specific worksheet in the file using the Workbook.Worksheets[] property.
- Save a specific chart in the worksheet to an image stream using the Workbook.SaveChartAsImage(worksheet: Worksheet, chartIndex: int) method.
- Save the image stream to an image file using the Stream.Save() method.
- Python
from spire.xls import *
from spire.xls.common import *

# Create a Workbook object
workbook = Workbook()
# Load an Excel file
workbook.LoadFromFile("Charts.xlsx")

# Get the first worksheet
sheet = workbook.Worksheets[0]

# Save the first chart in the worksheet to an image stream
image_stream = workbook.SaveChartAsImage(sheet, 0)

# Save the image stream to a PNG image file
image_stream.Save("Output/chart.png")

workbook.Dispose()

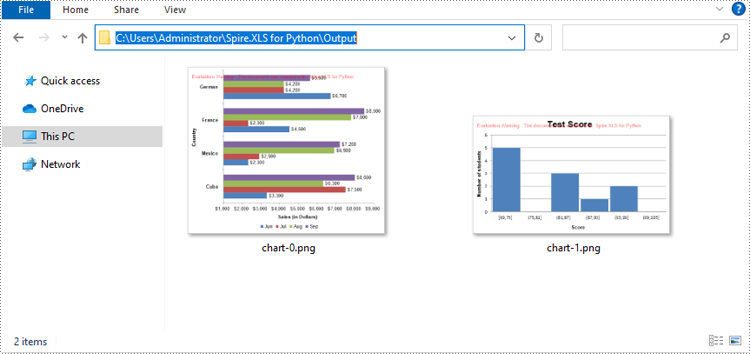
Convert All Charts in an Excel Worksheet to Images in Python
To convert all charts in an Excel worksheet to images, you can use the Workbook.SaveChartAsImage(worksheet: Worksheet) method. The detailed steps are as follows.
- Create an object of the Workbook class.
- Load an Excel file using the Workbook.LoadFromFile() method.
- Get a specific worksheet in the file using the Workbook.Worksheets[] property.
- Save all charts in the worksheet to a list of image streams using the Workbook.SaveChartAsImage(worksheet: Worksheet) method.
- Iterate through the image streams in the list and save them to separate image files.
- Python
from spire.xls import *
from spire.xls.common import *

# Create a Workbook object
workbook = Workbook()
# Load an Excel file
workbook.LoadFromFile("Charts.xlsx")

# Get the first worksheet
sheet = workbook.Worksheets[0]

image_streams = []
# Save the charts in the worksheet to a list of image streams
image_streams = workbook.SaveChartAsImage(sheet)

# Save the image streams to PNG image files
for i, image_stream in enumerate(image_streams):
    image_stream.Save(f"Output/chart-{i}.png")

workbook.Dispose()

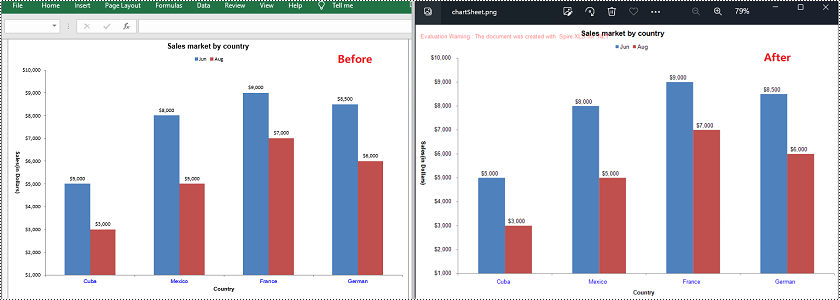
Convert a Chart Sheet in Excel to Image in Python
In Microsoft Excel, a chart sheet is a special type of sheet that is dedicated to displaying a single chart or graph. You can convert a chart sheet in an Excel workbook to an image using the Workbook.SaveChartAsImage(chartSheet: ChartSheet) method. The detailed steps are as follows.
- Create an object of the Workbook class.
- Load an Excel file using the Workbook.LoadFromFile() method.
- Get a specific chart sheet in the file using the Workbook.Chartsheets[] property.
- Save the chart sheet to an image stream using the Workbook.SaveChartAsImage(chartSheet: ChartSheet) method.
- Save the image stream to an image file.
- Python
from spire.xls import *
from spire.xls.common import *

# Create a Workbook object
workbook = Workbook()
# Load an Excel file
workbook.LoadFromFile("ChartSheet.xlsx")

# Get the first chart sheet
chart_sheet = workbook.Chartsheets[0]

# Save the chart sheet to an image stream
image_stream = workbook.SaveChartAsImage(chart_sheet)

# Save the image stream to a PNG image file
image_stream.Save("Output/chartSheet.png")

workbook.Dispose()

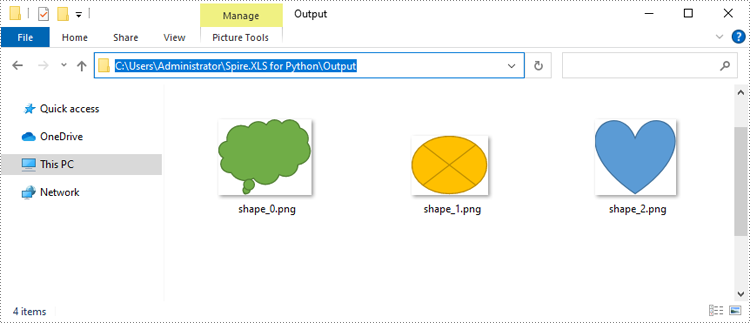
Convert Shapes in Excel to Images in Python
In addition to converting charts or chart sheets to images, you can also convert shapes in an Excel worksheet to images by using the XlsShape.SaveToImage() method. The detailed steps are as follows.
- Create an object of the Workbook class.
- Load an Excel file using the Workbook.LoadFromFile() method.
- Get a specific worksheet in the file using the Workbook.Worksheets[] property.
- Iterate through all the shapes in the worksheet.
- Typecast the shape to an XlsShape object.
- Save the shape to an image stream using the XlsShape.SaveToImage() method.
- Save the image stream to an image file.
- Python
from spire.xls import *
from spire.xls.common import *

# Create a Workbook object
workbook = Workbook()
# Load an Excel file
workbook.LoadFromFile("Shapes.xlsx")

# Get the first worksheet
sheet = workbook.Worksheets[0]

# Iterate through all the shapes in the worksheet
for i, shape in enumerate(sheet.PrstGeomShapes):
    xls_shape = XlsShape(shape)
    # Save the shape to an image stream
    image_stream = shape.SaveToImage()
    # Save the image stream to a PNG image file
    image_stream.Save(f"Output/shape_{i}.png")

workbook.Dispose()

Apply for a Temporary License
If you'd like to remove the evaluation message from the generated documents, or to get rid of the function limitations, please request a 30-day trial license for yourself.

