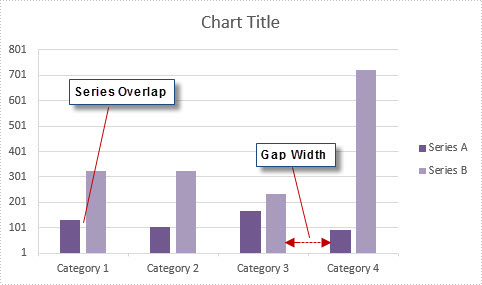
In MS Excel, the spaces between data bars have been defined as Series Overlap and Gap Width.
- Series Overlap: Spaces between data series within a single category.
- Gap Width: Spaces between two categories.
Check below picture, you'll have a better understanding of these two concepts. Normally the spaces are automatically calculated based on the date and chart area, the space may be very narrow or wide depending on how many date series you have in a fixed chart area. In this article, we'll introduce how to adjust the spaces between data bars using Spire.XLS.

Code Snippet:
Step 1: Initialize a new instance of Wordbook class and load the sample Excel file that contains some data in A1 to C5.
Workbook workbook = new Workbook();
workbook.LoadFromFile("sample.xlsx");
Step 2: Create a Column chart based on the data in cell range A1 to C5.
Worksheet sheet = workbook.Worksheets[0];
Chart chart = sheet.Charts.Add(ExcelChartType.ColumnClustered);
chart.DataRange = sheet.Range["A1:C5"];
chart.SeriesDataFromRange = false;
chart.PrimaryValueAxis.MajorGridLines.LineProperties.Color = Color.LightGray;
Step 3: Set chart position.
chart.LeftColumn = 5;
chart.TopRow = 7;
chart.RightColumn = 13;
chart.BottomRow = 21;
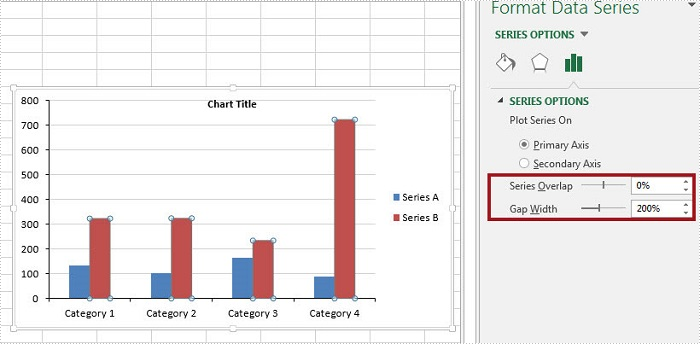
Step 4: The ChartSerieDataFormat class has two properties - GapWidth property and Overlap property to handle the Gap Width and Series Overlap respectively. The value of GapWidth varies from 0 to 500, and the value of Overlap varies from -100 to 100.
foreach (ChartSerie cs in chart.Series)
{
    cs.Format.Options.GapWidth = 200;
    cs.Format.Options.Overlap = 0;
}
Step 5: Save and launch the file.
workbook.SaveToFile("result.xlsx", ExcelVersion.Version2010);
System.Diagnostics.Process.Start("result.xlsx");
Output:

Full Code:
using Spire.Xls;
using Spire.Xls.Charts;
namespace AdjustSpaces
{

    class Program
    {

        static void Main(string[] args)
        {
            Workbook workbook = new Workbook();
            workbook.LoadFromFile("data.xlsx");

            Worksheet sheet = workbook.Worksheets[0];
            Chart chart = sheet.Charts.Add(ExcelChartType.ColumnClustered);
            chart.DataRange = sheet.Range["A1:C5"];
            chart.SeriesDataFromRange = false;
            chart.PrimaryValueAxis.MajorGridLines.LineProperties.Color = Color.LightGray;

            chart.LeftColumn = 5;
            chart.TopRow = 7;
            chart.RightColumn = 13;
            chart.BottomRow = 21;

            foreach (ChartSerie cs in chart.Series)
            {
                cs.Format.Options.GapWidth = 200;
                cs.Format.Options.Overlap = 0;
            }

            workbook.SaveToFile("result.xlsx", ExcelVersion.Version2010);
            System.Diagnostics.Process.Start("result.xlsx");

        }
    }
}
Imports Spire.Xls
Imports Spire.Xls.Charts
Namespace AdjustSpaces

	Class Program

		Private Shared Sub Main(args As String())
			Dim workbook As New Workbook()
			workbook.LoadFromFile("data.xlsx")

			Dim sheet As Worksheet = workbook.Worksheets(0)
			Dim chart As Chart = sheet.Charts.Add(ExcelChartType.ColumnClustered)
			chart.DataRange = sheet.Range("A1:C5")
			chart.SeriesDataFromRange = False
			chart.PrimaryValueAxis.MajorGridLines.LineProperties.Color = Color.LightGray

			chart.LeftColumn = 5
			chart.TopRow = 7
			chart.RightColumn = 13
			chart.BottomRow = 21

			For Each cs As ChartSerie In chart.Series
				cs.Format.Options.GapWidth = 200
				cs.Format.Options.Overlap = 0
			Next

			workbook.SaveToFile("result.xlsx", ExcelVersion.Version2010)
			System.Diagnostics.Process.Start("result.xlsx")

		End Sub
	End Class
End Namespace


