A Pivot Chart is a graphical representation of a Pivot Table. While a Pivot Table summarizes data and allows users to manipulate it for analysis, a Pivot Chart provides a visual representation of that summarized data. Pivot Charts can be easily updated as the data in the Pivot Table changes, making them an essential tool for reporting and analysis. In this article, we will demonstrate how to create pivot charts in Excel in C# using Spire.XLS for .NET.
- Create Pivot Charts in Excel in C#
- Show or Hide Field Buttons in Pivot Charts in Excel in C#
- Format Pivot Chart Series in Excel in C#
Install Spire.XLS for .NET
To begin with, you need to add the DLL files included in the Spire.XLS for .NET package as references in your .NET project. The DLL files can be either downloaded from this link or installed via NuGet.
PM> Install-Package Spire.XLS
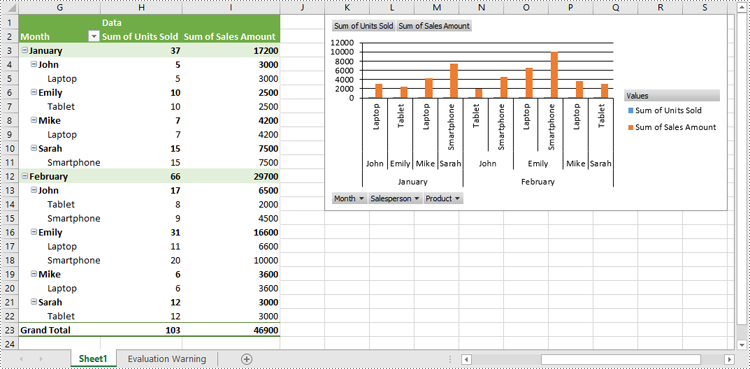
Create Pivot Charts in Excel in C#
With Spire.XLS for .NET, creating a pivot chart from an existing pivot table in Excel is straightforward using the Worksheet.Charts.Add(ExcelChartType pivotChartType, IPivotTable pivotTable) method. The detailed steps are as follows.
- Create an object of the Workbook class.
- Load an Excel file using Workbook.LoadFromFile() method.
- Get a specific worksheet in the Excel file using Workbook.Worksheets[index] property.
- Get a specific pivot table in the worksheet using Worksheet.PivotTables[index] property.
- Add a pivot chart based on the pivot table to the worksheet using Worksheet.Charts.Add(ExcelChartType pivotChartType, IPivotTable pivotTable) method.
- Set the position and title of the pivot chart.
- Save the resulting file using Workbook.SaveToFile() method.
- C#
using Spire.Xls;
using Spire.Xls.Core;

namespace CreatePivotChart
{
    internal class Program
    {
        static void Main(string[] args)
        {
            // Create a Workbook object
            Workbook workbook = new Workbook();

            // Load an Excel file
            workbook.LoadFromFile("PivotTable.xlsx");

            // Get the first worksheet
            Worksheet sheet = workbook.Worksheets[0];

            // Get the first pivot table in the worksheet
            IPivotTable pivotTable = sheet.PivotTables[0];

            // Create a clustered column chart based on the pivot table
            Chart pivotChart = sheet.Charts.Add(ExcelChartType.ColumnClustered, pivotTable);

            // Set chart position
            pivotChart.TopRow = 1;
            pivotChart.LeftColumn = 11;
            pivotChart.RightColumn = 20;
            pivotChart.BottomRow = 15;

            // Set chart title to null
            pivotChart.ChartTitle = "";

            // Save the resulting file
            workbook.SaveToFile("CreatePivotChart.xlsx", ExcelVersion.Version2013);
            workbook.Dispose();
        }
    }
}
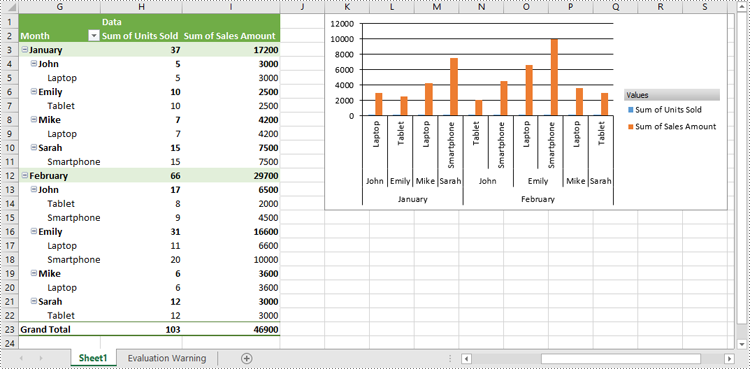
Show or Hide Field Buttons in Pivot Charts in Excel in C#
Using Spire.XLS for .NET, you can easily show or hide different types of field buttons to customize the appearance of your charts. The field buttons you can control include:
- Entire Field Buttons
- Report Filter Field Buttons
- Legend Field Buttons
- Axis Field Buttons
- Value Field Buttons
The detailed steps are as follows:
- Create an object of the Workbook class.
- Load an Excel file using Workbook.LoadFromFile() method.
- Get a specific worksheet in the Excel file using Workbook.Worksheets[index] property.
- Get a specific pivot table in the worksheet using Worksheet.PivotTables[index] property.
- Add a pivot chart based on the pivot table to the worksheet using Worksheet.Charts.Add(ExcelChartType pivotChartType, IPivotTable pivotTable) method.
- Set the position and title of the pivot chart.
- Hide specific field buttons in the pivot chart, such as the axis field buttons and the value field buttons, using Chart.DisplayAxisFieldButtons and Chart.DisplayValueFieldButtons properties.
- Save the resulting file using Workbook.SaveToFile() method.
- C#
using Spire.Xls;
using Spire.Xls.Core;

namespace ShowOrHideFieldButtons
{
    internal class Program
    {
        static void Main(string[] args)
        {
            // Create a Workbook object
            Workbook workbook = new Workbook();

            // Load an Excel file
            workbook.LoadFromFile("CreatePivotChart.xlsx");

            // Get the first worksheet
            Worksheet sheet = workbook.Worksheets[0];

            // Get the first pivot table in the worksheet
            IPivotTable pivotTable = sheet.PivotTables[0];

            // Create a clustered column chart based on the pivot table
            Chart pivotChart = sheet.Charts.Add(ExcelChartType.ColumnClustered, pivotTable);

            // Set chart position
            pivotChart.TopRow = 1;
            pivotChart.LeftColumn = 11;
            pivotChart.RightColumn = 20;
            pivotChart.BottomRow = 15;

            // Set chart title to null
            pivotChart.ChartTitle = "";

            // Hide specific field buttons
            pivotChart.DisplayAxisFieldButtons = false;
            pivotChart.DisplayValueFieldButtons = false;
            // pivotChart.DisplayLegendFieldButtons = false;
            // pivotChart.ShowReportFilterFieldButtons = false;
            // pivotChart.DisplayEntireFieldButtons = false;

            // Save the resulting file
            workbook.SaveToFile("HideFieldButtons.xlsx", ExcelVersion.Version2013);
            workbook.Dispose();
        }
    }
}
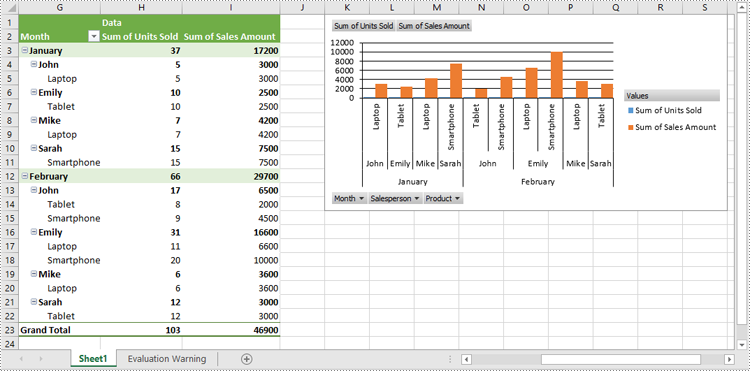
Format Pivot Chart Series in Excel in C#
When creating a pivot chart in Excel from a pivot table using Spire.XLS for .NET, it's important to note that the chart series do not get generated automatically. Instead, you must manually add the series and format them according to your preferences. The detailed steps are as follows:
- Create an object of the Workbook class.
- Load an Excel file using Workbook.LoadFromFile() method.
- Get a specific worksheet in the Excel file using Workbook.Worksheets[index] property.
- Get a specific pivot table in the worksheet using Worksheet.PivotTables[index] property.
- Add a pivot chart based on the pivot table to the worksheet using Worksheet.Charts.Add(ExcelChartType pivotChartType, IPivotTable pivotTable) method.
- Set the position and title of the pivot chart.
- Add series to the chart using Chart.Series.Add() method and then apply the desired formatting to the series.
- Save the resulting file using Workbook.SaveToFile() method.
- C#
using Spire.Xls;
using Spire.Xls.Charts;
using Spire.Xls.Core;

namespace FormatChartSeries
{
    internal class Program
    {
        static void Main(string[] args)
        {
            // Create a Workbook object
            Workbook workbook = new Workbook();

            // Load an Excel file
            workbook.LoadFromFile("CreatePivotChart.xlsx");

            // Get the first worksheet
            Worksheet sheet = workbook.Worksheets[0];

            // Get the first pivot table in the worksheet
            IPivotTable pivotTable = sheet.PivotTables[0];

            // Create a clustered column chart based on the pivot table
            Chart pivotChart = sheet.Charts.Add(ExcelChartType.ColumnClustered, pivotTable);

            // Set chart position
            pivotChart.TopRow = 1;
            pivotChart.LeftColumn = 11;
            pivotChart.RightColumn = 20;
            pivotChart.BottomRow = 15;

            // Set chart title to null
            pivotChart.ChartTitle = "";

            // Add chart series
            ChartSerie series = pivotChart.Series.Add(ExcelChartType.ColumnClustered);

            // Set bar width
            series.GetCommonSerieFormat().GapWidth = 10;

            // Set overlap (uncomment the line below to enable)
            // series.GetCommonSerieFormat().Overlap = 100;

            // Save the resulting file
            workbook.SaveToFile("FormatChartSeries.xlsx", ExcelVersion.Version2013);
            workbook.Dispose();
        }
    }
}
Apply for a Temporary License
If you'd like to remove the evaluation message from the generated documents, or to get rid of the function limitations, please request a 30-day trial license for yourself.