Data Bars in Excel is a feature within the Conditional Formatting tool that allows you to visually represent numerical data through a series of bars. This feature is particularly useful for comparing values at a glance, as the length of the bar corresponds to the magnitude of the value it represents. In this article, you will learn how to add data bars in an Excel cell range in Python using Spire.XLS for Python.
Install Spire.XLS for Python
This scenario requires Spire.XLS for Python and plum-dispatch v1.7.4. They can be easily installed in your Windows through the following pip command.
pip install Spire.XLS
If you are unsure how to install, please refer to this tutorial: How to Install Spire.XLS for Python on Windows
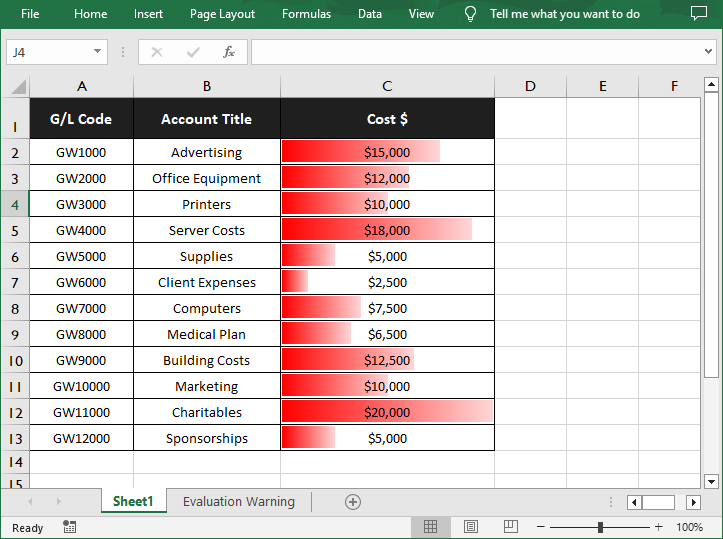
Add Data Bars in Excel in Python
With Spire.XLS for Python, you are allowed to add a data bar to a specified data range and also set its format. The following are the detailed steps.
- Create a Workbook instance.
- Load a sample Excel document using Workbook.LoadFromFile() method.
- Get a specified worksheet using Workbook.Worsheets[index] property.
- Add a conditional formatting to the worksheet using Worksheet.ConditionalFormats.Add() method and return an object of XlsConditionalFormats class.
- Set the cell range where the conditional formatting will be applied using XlsConditionalFormats.AddRange() method.
- Add a condition using XlsConditionalFormats.AddCondition() method, and then set its format type to DataBar using IConditionalFormat.FormatType property.
- Set the fill effect and color of the data bars using IConditionalFormat.DataBar.BarFillType and IConditionalFormat.DataBar.BarColor properties.
- Save the result document using Workbook.SaveToFile() method.
- Python
from spire.xls import *
from spire.xls.common import *

# Create a Workbook instance
workbook = Workbook()

# Load a sample Excel document
workbook.LoadFromFile("sample.xlsx")

# Get the first worksheet
sheet = workbook.Worksheets[0]

# Add a conditional format to the worksheet
xcfs = sheet.ConditionalFormats.Add()

# Set the range where the conditional format will be applied
xcfs.AddRange(sheet.Range["C2:C13"])

# Add a condition and set its format type to DataBar
format = xcfs.AddCondition()
format.FormatType = ConditionalFormatType.DataBar

# Set the fill effect and color of the data bars
format.DataBar.BarFillType = DataBarFillType.DataBarFillGradient
format.DataBar.BarColor = Color.get_Red()

# Save the result document
workbook.SaveToFile("ApplyDataBarsToCellRange.xlsx", ExcelVersion.Version2016)
workbook.Dispose()
Apply for a Temporary License
If you'd like to remove the evaluation message from the generated documents, or to get rid of the function limitations, please request a 30-day trial license for yourself.