Conditional Formatting (2)
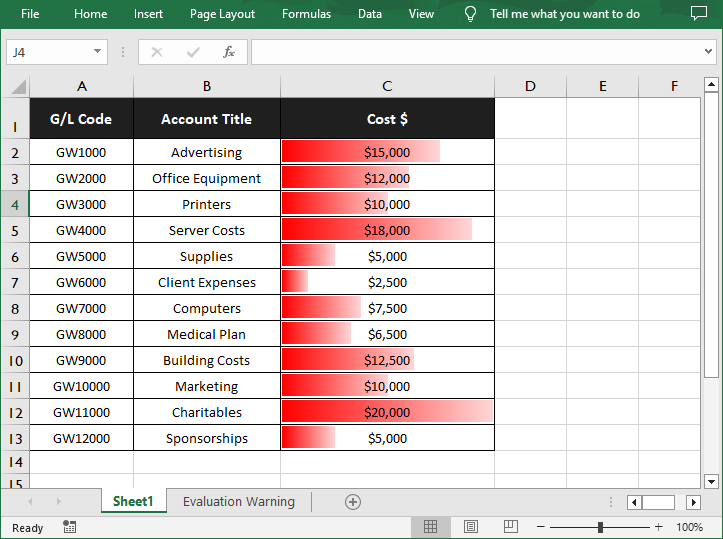
Data Bars in Excel is a feature within the Conditional Formatting tool that allows you to visually represent numerical data through a series of bars. This feature is particularly useful for comparing values at a glance, as the length of the bar corresponds to the magnitude of the value it represents. In this article, you will learn how to add data bars in an Excel cell range in Python using Spire.XLS for Python.
Install Spire.XLS for Python
This scenario requires Spire.XLS for Python and plum-dispatch v1.7.4. They can be easily installed in your Windows through the following pip command.
pip install Spire.XLS
If you are unsure how to install, please refer to this tutorial: How to Install Spire.XLS for Python on Windows
Add Data Bars in Excel in Python
With Spire.XLS for Python, you are allowed to add a data bar to a specified data range and also set its format. The following are the detailed steps.
- Create a Workbook instance.
- Load a sample Excel document using Workbook.LoadFromFile() method.
- Get a specified worksheet using Workbook.Worsheets[index] property.
- Add a conditional formatting to the worksheet using Worksheet.ConditionalFormats.Add() method and return an object of XlsConditionalFormats class.
- Set the cell range where the conditional formatting will be applied using XlsConditionalFormats.AddRange() method.
- Add a condition using XlsConditionalFormats.AddCondition() method, and then set its format type to DataBar using IConditionalFormat.FormatType property.
- Set the fill effect and color of the data bars using IConditionalFormat.DataBar.BarFillType and IConditionalFormat.DataBar.BarColor properties.
- Save the result document using Workbook.SaveToFile() method.
- Python
from spire.xls import *
from spire.xls.common import *

# Create a Workbook instance
workbook = Workbook()

# Load a sample Excel document
workbook.LoadFromFile("sample.xlsx")

# Get the first worksheet
sheet = workbook.Worksheets[0]

# Add a conditional format to the worksheet
xcfs = sheet.ConditionalFormats.Add()

# Set the range where the conditional format will be applied
xcfs.AddRange(sheet.Range["C2:C13"])

# Add a condition and set its format type to DataBar
format = xcfs.AddCondition()
format.FormatType = ConditionalFormatType.DataBar

# Set the fill effect and color of the data bars
format.DataBar.BarFillType = DataBarFillType.DataBarFillGradient
format.DataBar.BarColor = Color.get_Red()

# Save the result document
workbook.SaveToFile("ApplyDataBarsToCellRange.xlsx", ExcelVersion.Version2016)
workbook.Dispose()
Apply for a Temporary License
If you'd like to remove the evaluation message from the generated documents, or to get rid of the function limitations, please request a 30-day trial license for yourself.
Conditional formatting is a powerful feature in Microsoft Excel that allows users to apply formatting rules to cells based on specific conditions or criteria. It provides a quick and efficient way to visually highlight and analyze data, making it easier to identify trends, patterns, and outliers. With conditional formatting, users can customize the appearance of cells, such as font color, cell background, and borders, to draw attention to specific data points or results. In this article, you will learn how to programmatically apply conditional formatting in Excel in Python using Spire.XLS for Python.
- Alternate Row Colors in Excel Using Conditional Formatting in Python
- Highlight Top or Bottom Ranked Values in Excel in Python
- Highlight Values Below or Above Average in Excel in Python
- Highlight Values Between Two Numbers in Excel in Python
Install Spire.XLS for Python
This scenario requires Spire.XLS for Python and plum-dispatch v1.7.4. They can be easily installed in your Windows through the following pip command.
pip install Spire.XLS
If you are unsure how to install, please refer to this tutorial: How to Install Spire.XLS for Python on Windows
Alternate Row Colors in Excel Using Conditional Formatting in Python
Apply alternating row colors enhances the readability and visual appeal of a spreadsheet. By using different background colors for adjacent rows, it makes it easier to distinguish and follow individual rows of data. The following are the steps to alternate row colors in Excel using conditional formatting with Spire.XLS for Python.
- Create a Workbook object.
- Load an Excel file using Workbook.LoadFromFile() method.
- Get a specific worksheet from the workbook through Workbook.Worsheets[index] property.
- Add a conditional format to the worksheet using Worksheet.ConditionalFormats.Add() method and return an object of XlsConditionalFormats class.
- Specify the cell range where the conditional formatting will be applied using XlsConditionalFormats.AddRange() method.
- Add a condition using XlsConditionalFormats.AddCondition() method to change the color of even rows.
- Add another condition to change the color of odd rows.
- Save the workbook to an Excel file using Workbook.SaveToFile() method.
- Python
from spire.xls import *
from spire.xls.common import *

# Create a Workbook object
workbook = Workbook()

# Load a file from disk
workbook.LoadFromFile("C:/Users/Administrator/Desktop/input.xlsx")

# Get the first worksheet
sheet = workbook.Worksheets[0]

# Add a conditional format to the worksheet
conditionalForamt = sheet.ConditionalFormats.Add()

# Specify the range where the conditional format will be applied
conditionalForamt .AddRange(sheet.Range[2, 1, sheet.LastRow, sheet.LastColumn])

# Specify the first condition and format the cells that match the condition
condition1 = conditionalForamt .AddCondition()
condition1.FirstFormula = "=MOD(ROW(),2)=0"
condition1.FormatType = ConditionalFormatType.Formula
condition1.BackColor = Color.get_White()

# Specify the second condition and format the cells that match the condition
condition2 = conditionalForamt.AddCondition()
condition2.FirstFormula = "=MOD(ROW(),2)=1"
condition2.FormatType = ConditionalFormatType.Formula
condition2.BackColor = Color.get_LightGray()

# Save to file
workbook.SaveToFile("output/AlternateRowColors.xlsx", ExcelVersion.Version2016)
workbook.Dispose()

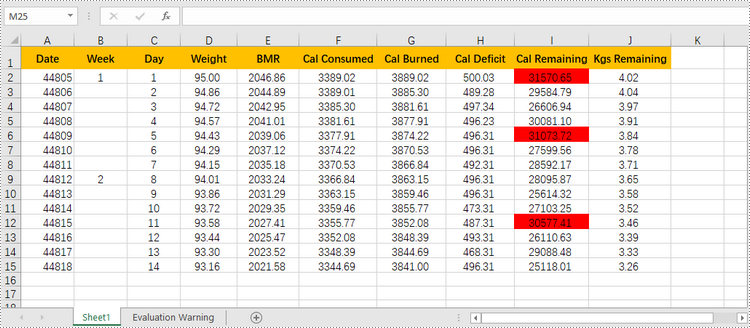
Highlight Top or Bottom Ranked Values in Excel
Highlighting top-ranked or bottom-ranked values in Excel can quickly identify the highest or the lowest values within a range or dataset, making it easier to analyze and interpret the data. The following are the steps to highlight top or bottom ranked values in Excel using conditional formatting with Spire.XLS for Python.
- Create a Workbook object.
- Load an Excel file using Workbook.LoadFromFile() method.
- Get a specific worksheet from the workbook through Workbook.Worsheets[index] property.
- Add a conditional format to the worksheet using Worksheet.ConditionalFormats.Add() method and return an object of XlsConditionalFormats class.
- Specify the cell range where the conditional formatting will be applied using XlsConditionalFormats.AddRange() method.
- Add a condition using XlsConditionalFormats.AddCondition() method to change the color of the cells that have top ranked or bottom ranked values.
- Save the workbook to an Excel file using Workbook.SaveToFile() method.
- Python
from spire.xls import *
from spire.xls.common import *

# Create a Workbook object
workbook = Workbook()

# Load a file from disk
workbook.LoadFromFile("C:/Users/Administrator/Desktop/input.xlsx")

# Get the first worksheet
sheet = workbook.Worksheets[0]

# Add a conditional format to the worksheet
conditionalForamt = sheet.ConditionalFormats.Add()

# Specify the range where the conditional format will be applied
conditionalForamt.AddRange(sheet.Range["I2:I15"])

# Add a condition to highlight the top 3 ranked values
condition1 = conditionalForamt.AddTopBottomCondition(TopBottomType.Top, 3)
condition1.BackColor = Color.get_Red()

# Add a condition to highlight the bottom 3 ranked values
# condition2 = conditionalForamt.AddTopBottomCondition(TopBottomType.Bottom, 3)
# condition2.BackColor = Color.get_Green()

# Save the workbook to an Excel file
workbook.SaveToFile("output/TopOrBottomValues.xlsx", ExcelVersion.Version2016)
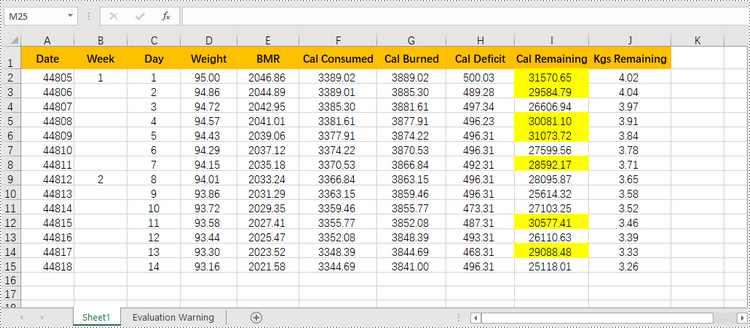
Highlight Values Below or Above Average in Excel
To quickly identify data points that are significantly higher or lower than the average, you can use conditional formatting as well. Here are the detailed steps.
- Create a Workbook object.
- Load an Excel file using Workbook.LoadFromFile() method.
- Get a specific worksheet from the workbook through Workbook.Worsheets[index] property.
- Add a conditional format to the worksheet using Worksheet.ConditionalFormats.Add() method and return an object of XlsConditionalFormats class.
- Specify the cell range where the conditional formatting will be applied using XlsConditionalFormats.AddRange() method.
- Add a condition using XlsConditionalFormats.AddCondition() method to change the color of the cells with values above or below the average.
- Save the workbook to an Excel file using Workbook.SaveToFile() method.
- Python
from spire.xls import *
from spire.xls.common import *

# Create a Workbook object
workbook = Workbook()

# Load a file from disk
workbook.LoadFromFile("C:/Users/Administrator/Desktop/input.xlsx")

# Get the first worksheet
sheet = workbook.Worksheets[0]

# Add a conditional format to the worksheet
conditionalForamt = sheet.ConditionalFormats.Add()

# Specify the range where the conditional format will be applied
conditionalForamt.AddRange(sheet.Range["I2:I15"])

# Add a condition to highlight the values above average
condition1 = conditionalForamt.AddAverageCondition(AverageType.Above)
condition1.BackColor = Color.get_Yellow()

# Add a condition to highlight the values below average
# condition2 = conditionalForamt.AddAverageCondition(AverageType.Below)
# condition2.BackColor = Color.get_DarkGray()

# Save the workbook to an Excel file
workbook.SaveToFile("output/AboveOrBelowAverage.xlsx", ExcelVersion.Version2016)
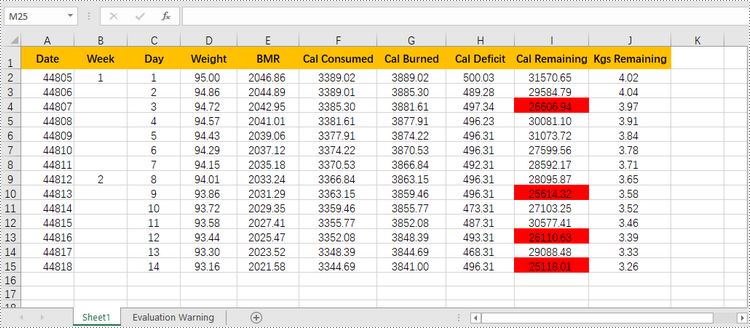
Highlight Values Between Two Numbers in Excel
Highlighting values between a specific range helps you quickly identify and focus on the relevant data points that fall within the range. The following are the steps to highlight values between two numbers using conditional formatting with Spire.XLS for Python.
- Create a Workbook object.
- Load an Excel file using Workbook.LoadFromFile() method.
- Get a specific worksheet from the workbook through Workbook.Worsheets[index] property.
- Add a conditional format to the worksheet using Worksheet.ConditionalFormats.Add() method and return an object of XlsConditionalFormats class.
- Specify the cell range where the conditional formatting will be applied using XlsConditionalFormats.AddRange() method.
- Add a condition using XlsConditionalFormats.AddCondition() method to change the color of the cells with values between two specific numbers.
- Save the workbook to an Excel file using Workbook.SaveToFile() method.
- Python
from spire.xls import *
from spire.xls.common import *

# Create a Workbook object
workbook = Workbook()

# Load a file from disk
workbook.LoadFromFile("C:/Users/Administrator/Desktop/input.xlsx")

# Get the first worksheet
sheet = workbook.Worksheets[0]

# Add a conditional format to the worksheet
conditionalForamt = sheet.ConditionalFormats.Add()

# Specify the range where the conditional format will be applied
conditionalForamt.AddRange(sheet.Range["I2:I15"])

# Create a condition and format the cells that meet the condition
condition = conditionalForamt.AddCondition()
condition.FormatType = ConditionalFormatType.CellValue
condition.Operator = ComparisonOperatorType.Between
condition.FirstFormula = "25000"
condition.SecondFormula = "27000"
condition.BackColor = Color.get_Red()

# Save the workbook to an Excel file
workbook.SaveToFile("output/ValuesBetweenTwoNumbers.xlsx", ExcelVersion.Version2016)
Apply for a Temporary License
If you'd like to remove the evaluation message from the generated documents, or to get rid of the function limitations, please request a 30-day trial license for yourself.