목차
핍으로 설치
pip install Spire.XLS
관련된 링크들
조건부 서식은 특정 조건이나 기준에 따라 셀에 서식 규칙을 적용할 수 있는 Microsoft Excel의 기능입니다. 이러한 조건은 셀 값, 수식 또는 기타 지정된 기준을 기반으로 할 수 있습니다. 조건부 서식을 사용하면 글꼴 색상, 셀 배경색, 테두리, 데이터 막대 등 셀 모양을 동적으로 변경하여 특정 데이터 요소를 시각적으로 강조할 수 있습니다. 이번 블로그에서는 Python을 사용하여 Excel에 조건부 서식 적용.
Excel에서 일반적으로 사용되는 몇 가지 유형의 조건부 서식 규칙에 대해 설명합니다.
Excel에 조건부 서식을 적용하는 Python 라이브러리
Python을 사용하여 Excel 파일에 조건부 서식을 적용하려면 이 기능을 지원하는 Python 모듈을 설치해야 합니다. 이번 블로그 포스팅에서는 Spire.XLS for Python 라이브러리는 셀 값, 수식 등과 같은 다양한 기준을 기반으로 Excel 파일에 조건부 서식 규칙을 적용하기 위해 특별히 설계된 포괄적인 함수 및 속성 세트를 제공합니다.
Spire.XLS for Python를 설치하려면 다음 pip 명령을 실행할 수 있습니다.
pip install Spire.XLS
셀 규칙 강조 표시
셀 강조 규칙은 해당 값을 기준으로 셀을 강조 표시할 수 있는 Excel의 조건부 서식 유형입니다. 보다 큼, 보다 작음, 같음, 사이 및 이상과 같은 조건을 설정하여 서식을 지정할 셀을 결정할 수 있습니다. 글꼴 색상, 배경색, 테두리와 같은 서식 옵션을 선택할 수 있습니다.
다음은 방법을 보여주는 예입니다 Excel에서 특정 값보다 크거나 작은 값을 포함하는 셀 강조 표시 Python 및 Spire.XLS for Python 사용:
- Python
from spire.xls import *
from spire.xls.common import *

# Create an object of the Workbook class
workbook = Workbook()
# Load an Excel file
workbook.LoadFromFile("Example1.xlsx")
# Get the first worksheet
sheet = workbook.Worksheets[0]

# Add a conditional format to the sheet
conditionalFormat = sheet.ConditionalFormats.Add()
# Specify the cell range to apply the conditional format
conditionalFormat.AddRange(sheet.Range["C2:C11"])

# Create the first condition to highlight cells containing values greater than a specific value
condition1 = conditionalFormat.AddCondition()
condition1.FormatType = ConditionalFormatType.CellValue
condition1.FirstFormula = "90"
condition1.Operator = ComparisonOperatorType.Greater
condition1.BackColor = Color.get_Yellow()

# Create the second condition to highlight cells containing values less than a specific value
condition2 = conditionalFormat.AddCondition()
condition2.FormatType = ConditionalFormatType.CellValue
condition2.FirstFormula = "80"
condition2.Operator = ComparisonOperatorType.Less
condition2.BackColor = Color.get_LightGreen()

# Save the result file
workbook.SaveToFile("HighlightCellRules.xlsx", ExcelVersion.Version2016)
workbook.Dispose()
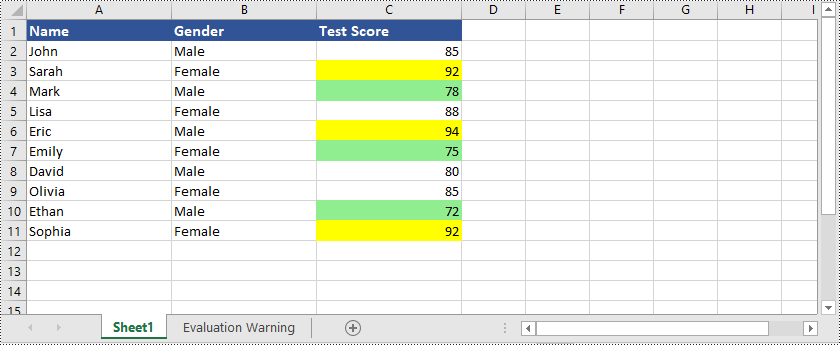
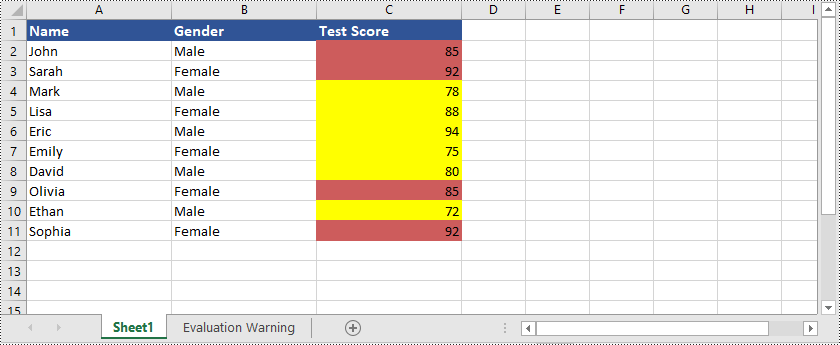
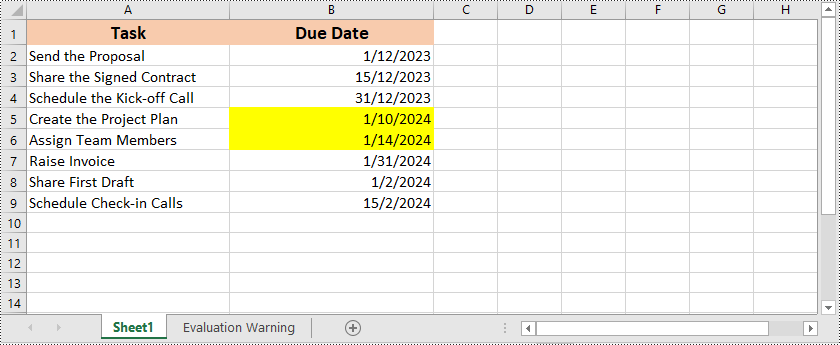
특정 값보다 크거나 작은 값이 있는 셀을 강조 표시하는 것 외에도 Spire.XLS for Python는 다른 많은 옵션도 지원합니다. 예를 들어 중복되거나 고유한 값이 있는 셀을 강조 표시하고 지정된 날짜 내에 있는 날짜가 있는 셀을 강조 표시할 수 있습니다. 기간 등이 있습니다.
다음은 방법을 보여주는 예입니다 Excel에서 중복되거나 고유한 값이 있는 셀 강조 표시 Python 및 Spire.XLS for Python 사용:
- Python
from spire.xls import *
from spire.xls.common import *

# Create an object of the Workbook class
workbook = Workbook()
# Load an Excel file
workbook.LoadFromFile("Example1.xlsx")
# Get the first worksheet
sheet = workbook.Worksheets[0]

# Add a conditional format to the worksheet
conditionalFormat = sheet.ConditionalFormats.Add()
# Specify the cell range to apply the conditional format
conditionalFormat.AddRange(sheet.Range["C2:C11"])

# Create the first condition to highlight cells containing duplicate values
condition1 = conditionalFormat.AddCondition()
condition1.FormatType = ConditionalFormatType.DuplicateValues
condition1.BackColor = Color.get_IndianRed()

# Create the second condition to highlight cells containing unique values
condition2 = conditionalFormat.AddCondition()
condition2.FormatType = ConditionalFormatType.UniqueValues
condition2.BackColor = Color.get_Yellow()

# Save the result file
workbook.SaveToFile("HighlightCellRules.xlsx", ExcelVersion.Version2016)
workbook.Dispose()
다음은 방법을 보여주는 예입니다 Excel에서 특정 기간에 속하는 날짜가 있는 셀 강조 표시 Python 및 Spire.XLS for Python 사용:
- Python
from spire.xls import *
from spire.xls.common import *

# Create an object of the Workbook class
workbook = Workbook()
# Load an Excel file
workbook.LoadFromFile("Example2.xlsx")
# Get the first worksheet
sheet = workbook.Worksheets[0]

# Add a conditional format to the worksheet
conditionalFormat = sheet.ConditionalFormats.Add()
# Specify the cell range to apply the conditional format
conditionalFormat.AddRange(sheet.Range["B2:B9"])

# Create a condition to highlight cells with dates that fall within a specific time period
condition = conditionalFormat.AddTimePeriodCondition(TimePeriodType.Last7Days)
condition.BackColor = Color.get_Yellow()

# Save the result file
workbook.SaveToFile("HighlightCellRules.xlsx", ExcelVersion.Version2016)
workbook.Dispose()
상위 또는 하위 규칙
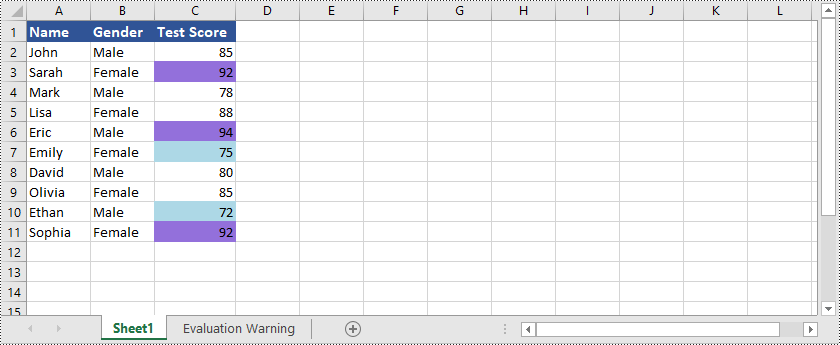
상위/하위 규칙은 범위 내에서 가장 높은 값이나 가장 낮은 값이 포함된 셀을 강조 표시할 수 있는 Excel의 또 다른 조건부 서식 유형입니다. 강조 표시할 상위 또는 하위 값의 수를 지정할 수 있으며 Excel에서는 선택한 규칙에 따라 서식을 자동으로 적용합니다.
다음은 방법을 보여주는 예입니다 Excel에서 상위 또는 하위 순위 값을 포함하는 셀 강조 표시 Python 및 Spire.XLS for Python 사용:
- Python
from spire.xls import *
from spire.xls.common import *

# Create an object of the Workbook class
workbook = Workbook()
# Load an Excel file
workbook.LoadFromFile("Example1.xlsx")
# Get the first worksheet
sheet = workbook.Worksheets[0]

# Add a conditional format to the worksheet
conditionalFormat = sheet.ConditionalFormats.Add()
# Specify the cell range to apply the conditional format
conditionalFormat.AddRange(sheet.Range["C2:C11"])

# Add the first condition to highlight the top 2 ranked values
condition1 = conditionalFormat.AddTopBottomCondition(TopBottomType.Top, 2)
condition1.BackColor = Color.get_MediumPurple()

# Add the second condition to highlight the bottom 2 ranked values
condition2 = conditionalFormat.AddTopBottomCondition(TopBottomType.Bottom, 2)
condition2.BackColor = Color.get_LightBlue()

# Save the result file
workbook.SaveToFile("TopOrBottomRules.xlsx", ExcelVersion.Version2016)
workbook.Dispose()
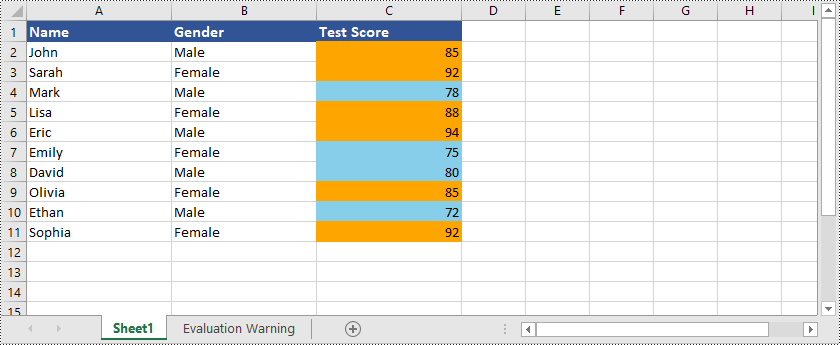
Spire.XLS for Python는 상위 또는 하위 값을 포함하는 셀을 강조 표시하는 것 외에도 다음을 수행할 수 있습니다 Excel에서 평균 값보다 높거나 낮은 값이 있는 셀을 강조 표시합니다. 다음 예를 참조할 수 있습니다.
- Python
from spire.xls import *
from spire.xls.common import *

# Create an object of the Workbook class
workbook = Workbook()
# Load an Excel file
workbook.LoadFromFile("Example1.xlsx")
# Get the first worksheet
sheet = workbook.Worksheets[0]

# Add a conditional format to the worksheet
conditionalFormat1 = sheet.ConditionalFormats.Add()
# Specify the cell range to apply the conditional format
conditionalFormat1.AddRange(sheet.Range["C2:C11"])

# Create a condition to highlight cells with values below the average
condition1 = conditionalFormat1.AddAverageCondition(AverageType.Below)
condition1.BackColor = Color.get_SkyBlue()

# Add a conditional format to the worksheet
conditionalFormat2 = sheet.ConditionalFormats.Add()
# Specify the cell range to apply the conditional format
conditionalFormat2.AddRange(sheet.Range["C2:C11"])

# Create a condition to highlight cells with values above the average
condition2 = conditionalFormat2.AddAverageCondition(AverageType.Above)
condition2.BackColor = Color.get_Orange()

# Save the result file
workbook.SaveToFile("HighlightValuesAboveOrBelowAverage.xlsx", ExcelVersion.Version2016)
workbook.Dispose()
데이터 막대
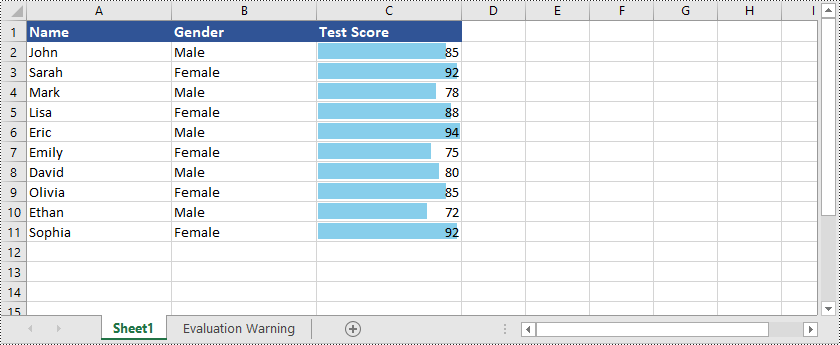
데이터 막대는 Excel의 조건부 서식을 시각적으로 표현한 것입니다. 데이터의 상대 값을 시각적으로 나타내는 셀 내에 가로 막대를 만듭니다. 막대의 길이는 셀의 값에 해당하므로 데이터 포인트를 쉽게 비교할 수 있습니다.
다음은 방법을 보여주는 예입니다 Excel에서 데이터 막대 만들기 Python 및 Spire.XLS for Python 사용:
- Python
from spire.xls import *
from spire.xls.common import *

# Create an object of the Workbook class
workbook = Workbook()
# Load an Excel file
workbook.LoadFromFile("Example1.xlsx")
# Get the first worksheet
sheet = workbook.Worksheets[0]

# Add a conditional format to the worksheet
conditionalFormat = sheet.ConditionalFormats.Add()
# Specify the cell range to apply the conditional format
conditionalFormat.AddRange(sheet.Range["C2:C11"])

# Add a condition and set its format type to DataBar
condition = conditionalFormat.AddCondition()
condition.FormatType = ConditionalFormatType.DataBar
# Set fill effect for data bars
# condition.DataBar.BarFillType = DataBarFillType.DataBarFillGradient
# Set bar color
condition.DataBar.BarColor = Color.get_SkyBlue()

# Save the result file
workbook.SaveToFile("DataBars.xlsx", ExcelVersion.Version2016)
workbook.Dispose()
색상 스케일
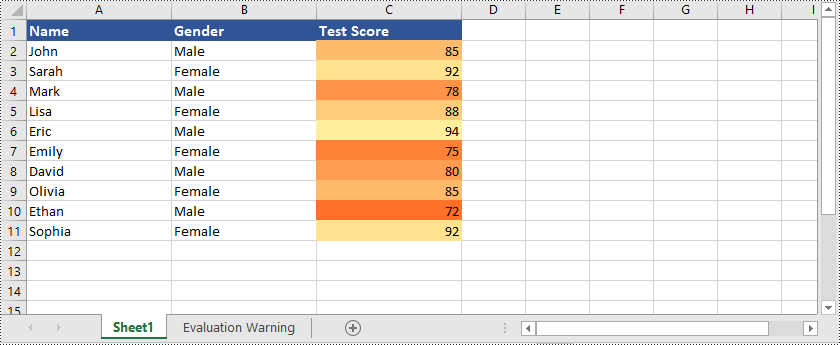
색상 스케일은 값에 따라 셀에 색상 그라데이션을 적용하는 조건부 서식 유형입니다. Excel에서는 다양한 색상을 사용하여 선택한 셀 범위 내의 값 분포를 나타냅니다. 더 높은 값에는 한 가지 색상이 할당되고, 더 낮은 값에는 다른 색상이 할당되며, 중간 값에 대해서는 그 사이에 음영이 지정됩니다. 색상 눈금은 데이터 분포를 시각적으로 표현하므로 높은 값과 낮은 값은 물론 데이터 세트 내 값의 상대적 위치도 쉽게 식별할 수 있습니다.
다음은 방법을 보여주는 예입니다 Excel에서 색상 스케일 만들기 Python 및 Spire.XLS for Python 사용:
- Python
from spire.xls import *
from spire.xls.common import *

# Create an object of the Workbook class
workbook = Workbook()
# Load an Excel file
workbook.LoadFromFile("Example1.xlsx")
# Get the first worksheet
sheet = workbook.Worksheets[0]

# Add a conditional format to the worksheet
conditionalFormat = sheet.ConditionalFormats.Add()
# Specify the cell range to apply the conditional format
conditionalFormat.AddRange(sheet.Range["C2:C11"])

# Add a condition and set its format type to ColorScale
condition = conditionalFormat.AddCondition()
condition.FormatType = ConditionalFormatType.ColorScale

# Save the result file
workbook.SaveToFile("ColorScales.xlsx", ExcelVersion.Version2016)
workbook.Dispose()
아이콘 세트
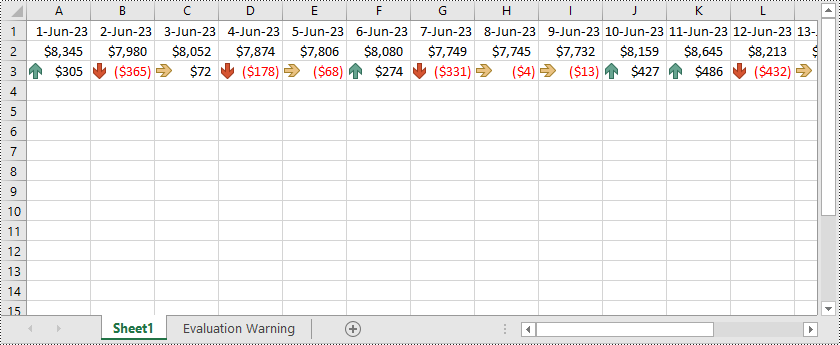
아이콘 집합은 화살표, 기호, 신호등과 같은 시각적 아이콘을 사용하여 셀 내의 다양한 조건이나 값을 나타내는 조건부 서식 유형입니다. Excel에서는 특정 기준이나 값 범위에 따라 적용할 수 있는 미리 정의된 아이콘 집합을 제공합니다. 예를 들어 화살표 아이콘을 사용하여 값이 증가하는지 감소하는지 여부를 나타내거나 신호등 아이콘을 사용하여 특정 메트릭의 상태를 나타낼 수 있습니다. 아이콘 세트는 할당된 아이콘을 기반으로 데이터를 해석하고 비교할 수 있는 시각적으로 직관적인 방법을 제공합니다.
다음은 방법을 보여주는 예입니다 Excel에서 아이콘 세트 만들기 Python 및 Spire.XLS for Python 사용:
- Python
from spire.xls import *
from spire.xls.common import *

# Create an object of the Workbook class
workbook = Workbook()
# Load an Excel file
workbook.LoadFromFile("Example3.xlsx")
# Get the first worksheet
sheet = workbook.Worksheets[0]

# Add a conditional format to the worksheet
conditionalFormat = sheet.ConditionalFormats.Add()
# Specify the cell range to apply the conditional format
conditionalFormat.AddRange(sheet.Range["A3:R3"])

# Add a condition and set its format type to IconSet
condition = conditionalFormat.AddCondition()
condition.FormatType = ConditionalFormatType.IconSet
# Set the type of icon sets to ThreeArrows
condition.IconSet.IconSetType = IconSetType.ThreeArrows

# Save the result file
workbook.SaveToFile("IconSets.xlsx", ExcelVersion.Version2013)
workbook.Dispose()
수식 기반 규칙
수식 기반 조건부 서식을 사용하면 수식을 사용하여 사용자 정의 규칙을 생성할 수 있는 유연성을 얻을 수 있습니다. 함수, 연산자, 셀 참조를 활용하여 복잡한 조건을 정의할 수 있습니다. 이를 통해 특정 계산이나 비교를 기반으로 고도로 맞춤화된 형식을 지정할 수 있습니다.
다음은 방법을 보여주는 예입니다 Excel에 수식 기반 조건부 서식 적용 Python 및 Spire.XLS for Python 사용:
- Python
from spire.xls import *
from spire.xls.common import *

# Create an object of the Workbook class
workbook = Workbook()
# Load an Excel file
workbook.LoadFromFile("Example1.xlsx")
# Get the first worksheet
sheet = workbook.Worksheets[0]

# Add a conditional format to the worksheet
conditionalFormat = sheet.ConditionalFormats.Add()
# Specify the cell range to apply the conditional format
conditionalFormat.AddRange(sheet.Range["A2:C11"])

# Add a condition and set its format type to Formula
condition = conditionalFormat.AddCondition()
condition.FormatType = ConditionalFormatType.Formula
condition.FirstFormula = "=MOD(ROW(),2)=1"
condition.BackColor = Color.get_LightGray()

# Save the result file
workbook.SaveToFile("FormulaBasedRules.xlsx", ExcelVersion.Version2016)
workbook.Dispose()

무료 라이센스 받기
평가 제한 없이 Spire.XLS for Python의 기능을 완전히 경험하려면 다음을 요청할 수 있습니다. 30일 무료 평가판 라이센스.
결론
이 블로그에서는 Python용 Spire.XLS를 사용하여 Excel에 다양한 유형의 조건부 서식을 적용하는 방법을 설명했습니다. 질문이 있으시면 언제든지 저희 사이트에 게시해 주시기 바랍니다 법정 또는 다음을 통해 지원팀에 보내세요 이메일.
