Sommario
Installa con Pip
pip install Spire.XLS
Link correlati
La formattazione condizionale è una funzionalità di Microsoft Excel che consente di applicare regole di formattazione alle celle in base a condizioni o criteri specifici. Queste condizioni possono essere basate su valori di cella, formule o altri criteri specificati. La formattazione condizionale consente di modificare dinamicamente l'aspetto delle celle, come il colore del carattere, il colore dello sfondo della cella, i bordi e le barre dei dati, per evidenziare o enfatizzare visivamente determinati punti dati. In questo blog esploreremo come farlo applicare la formattazione condizionale a Excel utilizzando Python.
Discuteremo alcuni tipi comunemente utilizzati di regole di formattazione condizionale in Excel:
- Evidenzia Regole cella
- Regole superiori o inferiori
- Barre dati
- Scale di colore
- Set di icone
- Regole basate su formule
Libreria Python per applicare la formattazione condizionale a Excel
Per applicare la formattazione condizionale ai file Excel utilizzando Python, dobbiamo installare un modulo Python che supporti questa funzionalità. In questo post del blog utilizzeremo la libreria Spire.XLS for Python, che offre un set completo di funzioni e proprietà progettate specificamente per applicare regole di formattazione condizionale ai file Excel in base a vari criteri come valori di cella, formule e altro.
Per installare Spire.XLS for Python, puoi eseguire il seguente comando pip:
pip install Spire.XLS
Evidenzia Regole cella
Le regole di evidenziazione delle celle sono un tipo di formattazione condizionale in Excel che consente di evidenziare le celle in base ai loro valori. Puoi impostare condizioni come maggiore di, minore di, uguale a, tra e altro per determinare quali celle devono essere formattate. Puoi scegliere opzioni di formattazione come colore del carattere, colore di sfondo e bordi.
Ecco un esempio che mostra come farlo evidenziare le celle contenenti valori maggiori o minori di un valore specifico in Excel utilizzando Python e Spire.XLS for Python:
- Python
from spire.xls import *
from spire.xls.common import *

# Create an object of the Workbook class
workbook = Workbook()
# Load an Excel file
workbook.LoadFromFile("Example1.xlsx")
# Get the first worksheet
sheet = workbook.Worksheets[0]

# Add a conditional format to the sheet
conditionalFormat = sheet.ConditionalFormats.Add()
# Specify the cell range to apply the conditional format
conditionalFormat.AddRange(sheet.Range["C2:C11"])

# Create the first condition to highlight cells containing values greater than a specific value
condition1 = conditionalFormat.AddCondition()
condition1.FormatType = ConditionalFormatType.CellValue
condition1.FirstFormula = "90"
condition1.Operator = ComparisonOperatorType.Greater
condition1.BackColor = Color.get_Yellow()

# Create the second condition to highlight cells containing values less than a specific value
condition2 = conditionalFormat.AddCondition()
condition2.FormatType = ConditionalFormatType.CellValue
condition2.FirstFormula = "80"
condition2.Operator = ComparisonOperatorType.Less
condition2.BackColor = Color.get_LightGreen()

# Save the result file
workbook.SaveToFile("HighlightCellRules.xlsx", ExcelVersion.Version2016)
workbook.Dispose()
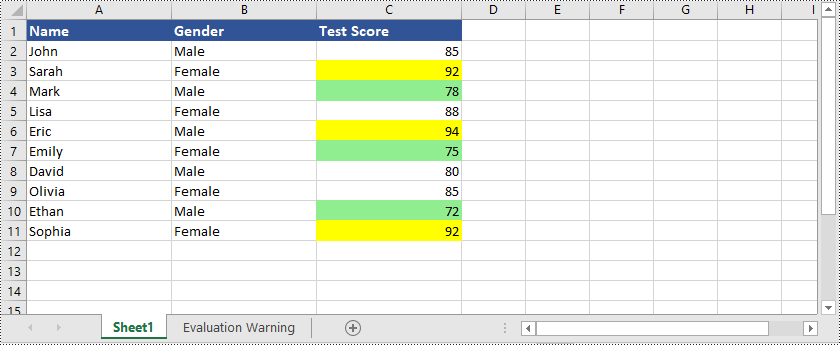
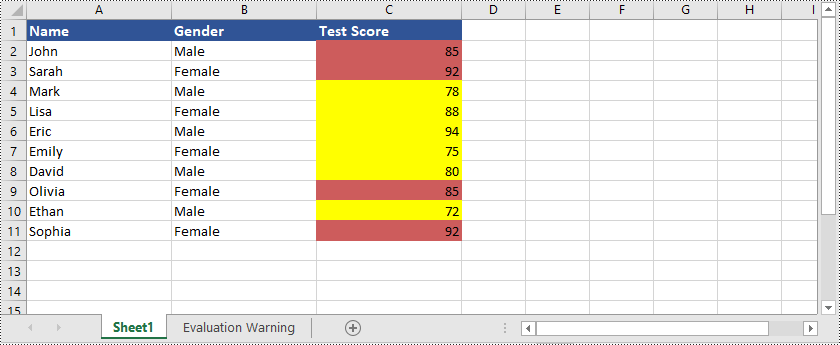
Oltre a evidenziare celle con valori maggiori o minori di un valore specifico, Spire.XLS for Python supporta anche molte altre opzioni, ad esempio è possibile evidenziare celle con valori duplicati o univoci, evidenziare celle con date che rientrano in un valore specificato periodo di tempo e molti altri.
Ecco un esempio che mostra come farlo evidenziare le celle con valori duplicati o univoci in Excel utilizzando Python e Spire.XLS for Python:
- Python
from spire.xls import *
from spire.xls.common import *

# Create an object of the Workbook class
workbook = Workbook()
# Load an Excel file
workbook.LoadFromFile("Example1.xlsx")
# Get the first worksheet
sheet = workbook.Worksheets[0]

# Add a conditional format to the worksheet
conditionalFormat = sheet.ConditionalFormats.Add()
# Specify the cell range to apply the conditional format
conditionalFormat.AddRange(sheet.Range["C2:C11"])

# Create the first condition to highlight cells containing duplicate values
condition1 = conditionalFormat.AddCondition()
condition1.FormatType = ConditionalFormatType.DuplicateValues
condition1.BackColor = Color.get_IndianRed()

# Create the second condition to highlight cells containing unique values
condition2 = conditionalFormat.AddCondition()
condition2.FormatType = ConditionalFormatType.UniqueValues
condition2.BackColor = Color.get_Yellow()

# Save the result file
workbook.SaveToFile("HighlightCellRules.xlsx", ExcelVersion.Version2016)
workbook.Dispose()
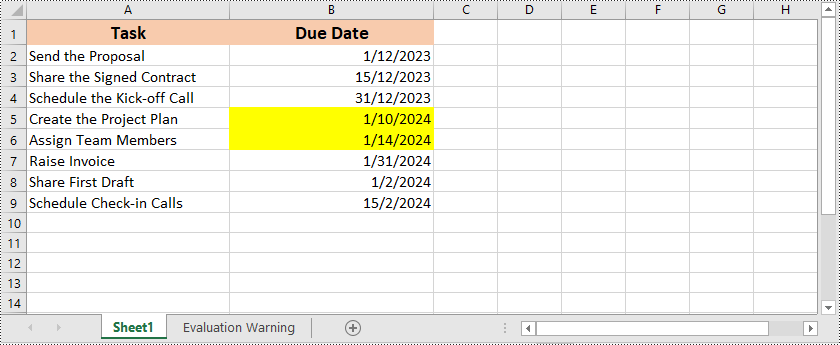
Ecco un esempio che mostra come farlo evidenziare le celle con date che rientrano in un periodo di tempo specifico in Excel utilizzando Python e Spire.XLS for Python:
- Python
from spire.xls import *
from spire.xls.common import *

# Create an object of the Workbook class
workbook = Workbook()
# Load an Excel file
workbook.LoadFromFile("Example2.xlsx")
# Get the first worksheet
sheet = workbook.Worksheets[0]

# Add a conditional format to the worksheet
conditionalFormat = sheet.ConditionalFormats.Add()
# Specify the cell range to apply the conditional format
conditionalFormat.AddRange(sheet.Range["B2:B9"])

# Create a condition to highlight cells with dates that fall within a specific time period
condition = conditionalFormat.AddTimePeriodCondition(TimePeriodType.Last7Days)
condition.BackColor = Color.get_Yellow()

# Save the result file
workbook.SaveToFile("HighlightCellRules.xlsx", ExcelVersion.Version2016)
workbook.Dispose()
Regole superiori o inferiori
Le regole Superiore/Inferiore sono un altro tipo di formattazione condizionale in Excel che consente di evidenziare le celle contenenti i valori più alti o più bassi all'interno di un intervallo. È possibile specificare il numero di valori superiori o inferiori da evidenziare ed Excel applicherà automaticamente la formattazione in base alla regola selezionata.
Ecco un esempio che mostra come farlo evidenziare le celle contenenti i valori classificati in alto o in basso in Excel utilizzando Python e Spire.XLS for Python:
- Python
from spire.xls import *
from spire.xls.common import *

# Create an object of the Workbook class
workbook = Workbook()
# Load an Excel file
workbook.LoadFromFile("Example1.xlsx")
# Get the first worksheet
sheet = workbook.Worksheets[0]

# Add a conditional format to the worksheet
conditionalFormat = sheet.ConditionalFormats.Add()
# Specify the cell range to apply the conditional format
conditionalFormat.AddRange(sheet.Range["C2:C11"])

# Add the first condition to highlight the top 2 ranked values
condition1 = conditionalFormat.AddTopBottomCondition(TopBottomType.Top, 2)
condition1.BackColor = Color.get_MediumPurple()

# Add the second condition to highlight the bottom 2 ranked values
condition2 = conditionalFormat.AddTopBottomCondition(TopBottomType.Bottom, 2)
condition2.BackColor = Color.get_LightBlue()

# Save the result file
workbook.SaveToFile("TopOrBottomRules.xlsx", ExcelVersion.Version2016)
workbook.Dispose()
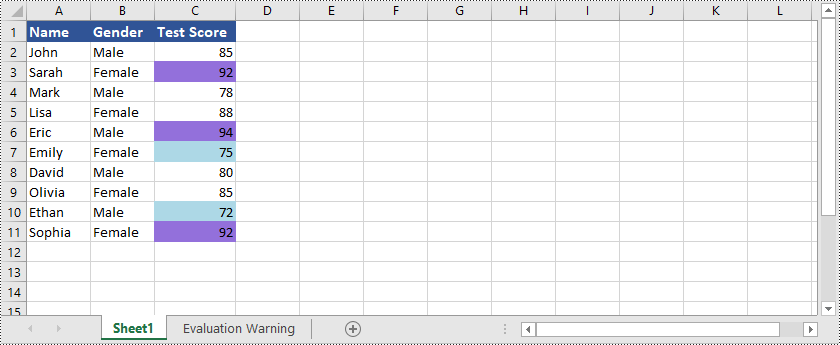
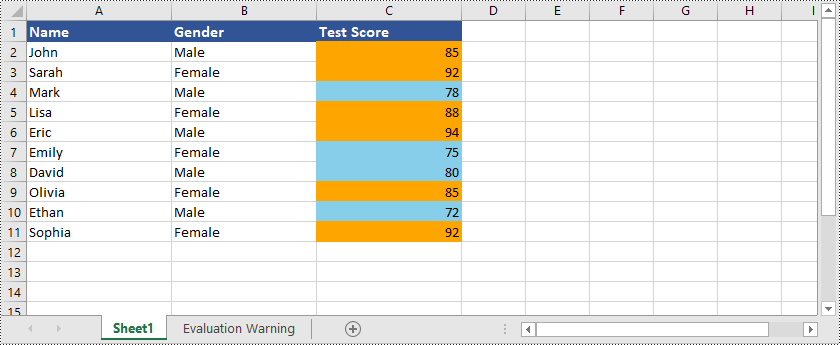
Oltre a evidenziare le celle contenenti i valori in cima o in fondo alla classifica, Spire.XLS for Python è anche in grado di farlo evidenziando le celle con valori superiori o inferiori al valore medio in Excel. È possibile fare riferimento al seguente esempio:
- Python
from spire.xls import *
from spire.xls.common import *

# Create an object of the Workbook class
workbook = Workbook()
# Load an Excel file
workbook.LoadFromFile("Example1.xlsx")
# Get the first worksheet
sheet = workbook.Worksheets[0]

# Add a conditional format to the worksheet
conditionalFormat1 = sheet.ConditionalFormats.Add()
# Specify the cell range to apply the conditional format
conditionalFormat1.AddRange(sheet.Range["C2:C11"])

# Create a condition to highlight cells with values below the average
condition1 = conditionalFormat1.AddAverageCondition(AverageType.Below)
condition1.BackColor = Color.get_SkyBlue()

# Add a conditional format to the worksheet
conditionalFormat2 = sheet.ConditionalFormats.Add()
# Specify the cell range to apply the conditional format
conditionalFormat2.AddRange(sheet.Range["C2:C11"])

# Create a condition to highlight cells with values above the average
condition2 = conditionalFormat2.AddAverageCondition(AverageType.Above)
condition2.BackColor = Color.get_Orange()

# Save the result file
workbook.SaveToFile("HighlightValuesAboveOrBelowAverage.xlsx", ExcelVersion.Version2016)
workbook.Dispose()
Barre dati
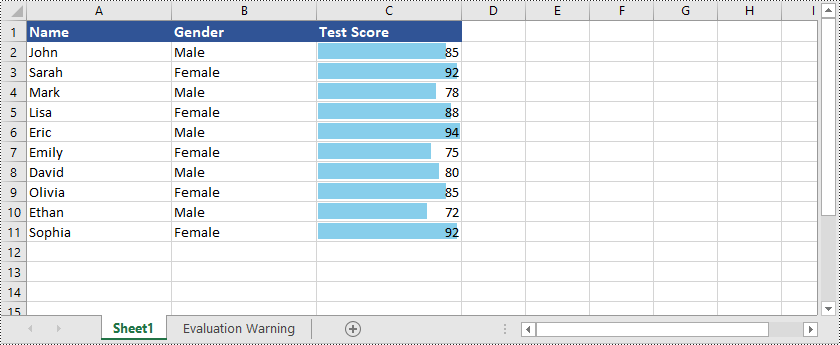
Le barre dati sono una rappresentazione visiva della formattazione condizionale in Excel. Creano barre orizzontali all'interno delle celle che rappresentano visivamente i valori relativi dei dati. La lunghezza della barra corrisponde al valore nella cella, consentendo un facile confronto dei punti dati.
Ecco un esempio che mostra come farlo creare barre dati in Excel utilizzando Python e Spire.XLS for Python:
- Python
from spire.xls import *
from spire.xls.common import *

# Create an object of the Workbook class
workbook = Workbook()
# Load an Excel file
workbook.LoadFromFile("Example1.xlsx")
# Get the first worksheet
sheet = workbook.Worksheets[0]

# Add a conditional format to the worksheet
conditionalFormat = sheet.ConditionalFormats.Add()
# Specify the cell range to apply the conditional format
conditionalFormat.AddRange(sheet.Range["C2:C11"])

# Add a condition and set its format type to DataBar
condition = conditionalFormat.AddCondition()
condition.FormatType = ConditionalFormatType.DataBar
# Set fill effect for data bars
# condition.DataBar.BarFillType = DataBarFillType.DataBarFillGradient
# Set bar color
condition.DataBar.BarColor = Color.get_SkyBlue()

# Save the result file
workbook.SaveToFile("DataBars.xlsx", ExcelVersion.Version2016)
workbook.Dispose()
Scale di colore
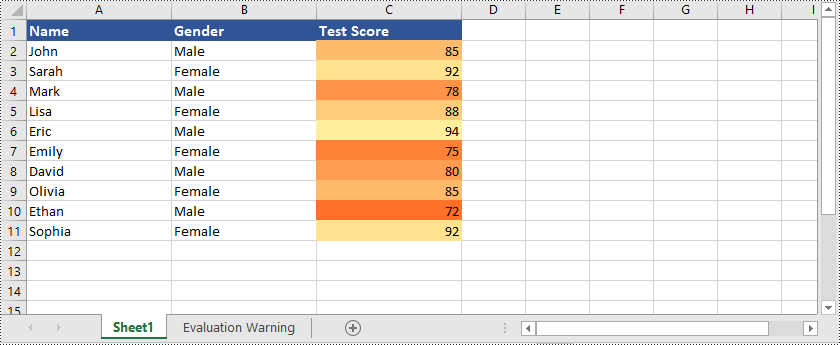
Le scale di colore sono un tipo di formattazione condizionale che applica sfumature di colore alle celle in base ai loro valori. Excel utilizza una gamma di colori per rappresentare la distribuzione dei valori all'interno di un intervallo selezionato di celle. Ai valori più alti viene assegnato un colore, mentre ai valori più bassi viene assegnato un altro colore, con sfumature intermedie per i valori intermedi. Le scale di colore forniscono una rappresentazione visiva della distribuzione dei dati, consentendo di identificare facilmente i valori alti e bassi, nonché il posizionamento relativo dei valori all'interno del set di dati.
Ecco un esempio che mostra come farlo creare scale di colori in Excel utilizzando Python e Spire.XLS for Python:
- Python
from spire.xls import *
from spire.xls.common import *

# Create an object of the Workbook class
workbook = Workbook()
# Load an Excel file
workbook.LoadFromFile("Example1.xlsx")
# Get the first worksheet
sheet = workbook.Worksheets[0]

# Add a conditional format to the worksheet
conditionalFormat = sheet.ConditionalFormats.Add()
# Specify the cell range to apply the conditional format
conditionalFormat.AddRange(sheet.Range["C2:C11"])

# Add a condition and set its format type to ColorScale
condition = conditionalFormat.AddCondition()
condition.FormatType = ConditionalFormatType.ColorScale

# Save the result file
workbook.SaveToFile("ColorScales.xlsx", ExcelVersion.Version2016)
workbook.Dispose()
Set di icone
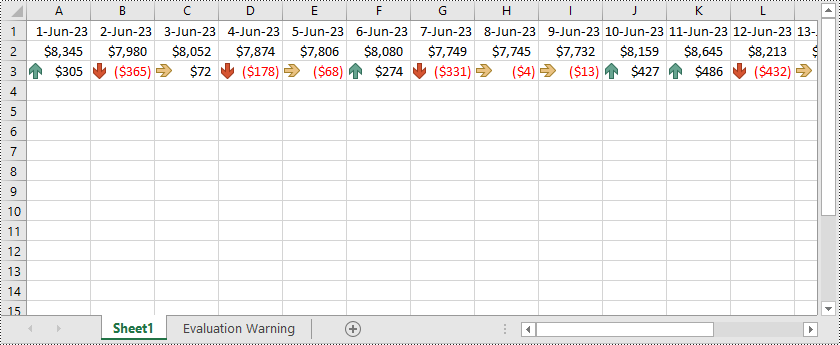
I set di icone sono un tipo di formattazione condizionale che utilizza icone visive, come frecce, simboli o semafori, per rappresentare condizioni o valori diversi all'interno delle celle. Excel fornisce set predefiniti di icone che è possibile applicare in base a criteri o intervalli di valori specifici. Ad esempio, puoi utilizzare le icone freccia per indicare se i valori sono in aumento o in diminuzione oppure utilizzare le icone semaforo per rappresentare lo stato di determinate metriche. I set di icone offrono un modo visivamente intuitivo per interpretare e confrontare i dati in base alle icone assegnate.
Ecco un esempio che mostra come farlo creare set di icone in Excel utilizzando Python e Spire.XLS for Python:
- Python
from spire.xls import *
from spire.xls.common import *

# Create an object of the Workbook class
workbook = Workbook()
# Load an Excel file
workbook.LoadFromFile("Example3.xlsx")
# Get the first worksheet
sheet = workbook.Worksheets[0]

# Add a conditional format to the worksheet
conditionalFormat = sheet.ConditionalFormats.Add()
# Specify the cell range to apply the conditional format
conditionalFormat.AddRange(sheet.Range["A3:R3"])

# Add a condition and set its format type to IconSet
condition = conditionalFormat.AddCondition()
condition.FormatType = ConditionalFormatType.IconSet
# Set the type of icon sets to ThreeArrows
condition.IconSet.IconSetType = IconSetType.ThreeArrows

# Save the result file
workbook.SaveToFile("IconSets.xlsx", ExcelVersion.Version2013)
workbook.Dispose()
Regole basate su formule
La formattazione condizionale basata su formule ti offre la flessibilità di creare regole personalizzate utilizzando le formule. È possibile definire condizioni complesse utilizzando funzioni, operatori e riferimenti di cella. Ciò consente una formattazione altamente personalizzata basata su calcoli o confronti specifici.
Ecco un esempio che mostra come farlo applicare la formattazione condizionale basata su formule a Excel utilizzando Python e Spire.XLS for Python:
- Python
from spire.xls import *
from spire.xls.common import *

# Create an object of the Workbook class
workbook = Workbook()
# Load an Excel file
workbook.LoadFromFile("Example1.xlsx")
# Get the first worksheet
sheet = workbook.Worksheets[0]

# Add a conditional format to the worksheet
conditionalFormat = sheet.ConditionalFormats.Add()
# Specify the cell range to apply the conditional format
conditionalFormat.AddRange(sheet.Range["A2:C11"])

# Add a condition and set its format type to Formula
condition = conditionalFormat.AddCondition()
condition.FormatType = ConditionalFormatType.Formula
condition.FirstFormula = "=MOD(ROW(),2)=1"
condition.BackColor = Color.get_LightGray()

# Save the result file
workbook.SaveToFile("FormulaBasedRules.xlsx", ExcelVersion.Version2016)
workbook.Dispose()

Ottieni una licenza gratuita
Per sperimentare appieno le funzionalità di Spire.XLS for Python senza limitazioni di valutazione, puoi richiedere una licenza di prova gratuita di 30 giorni.
Conclusione
Questo blog ha spiegato come applicare diversi tipi di formattazione condizionale a Excel utilizzando Spire.XLS per Python. In caso di domande, non esitate a pubblicarle sul nostro forum o inviarle al nostro team di supporto via e-mail.
