Sommario
Installa con Pip
pip install Spire.XLS
Link correlati
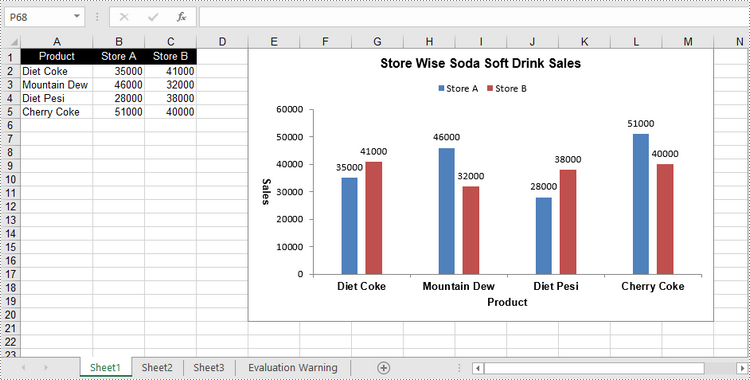
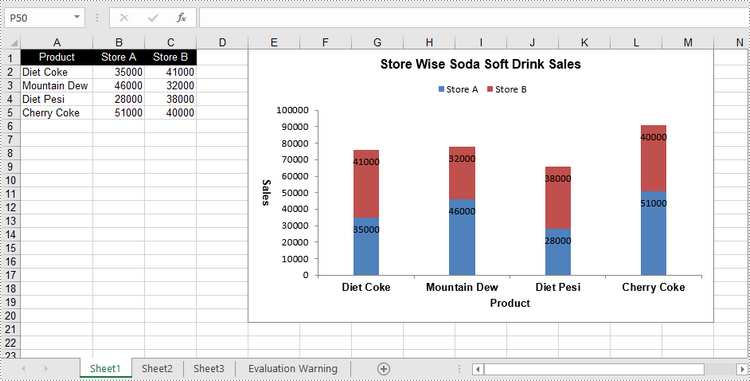
Un istogramma in cluster e un istogramma in pila sono due varianti dell'istogramma. L'istogramma in cluster consente un confronto diretto dei valori tra diverse categorie, mentre l'istogramma in pila mostra sia il totale per ciascuna categoria sia la proporzione dei suoi singoli componenti. In questo articolo imparerai come creare istogrammi in cluster o in pila in Excel in Python utilizzando Spire.XLS for Python.
- Crea un istogramma a colonne raggruppate in Excel in Python
- Crea un istogramma in pila in Excel in Python
Installa Spire.XLS for Python
Questo scenario richiede Spire.XLS for Python e plum-dispatch v1.7.4. Possono essere facilmente installati nel tuo VS Code tramite il seguente comando pip.
pip install Spire.XLS
Se non sei sicuro su come installare, fai riferimento a questo tutorial: Come installare Spire.XLS for Python in VS Code
Crea un istogramma a colonne raggruppate in Excel in Python
Per aggiungere un grafico a un foglio di lavoro, utilizzare il metodo Worksheet.Chart.Add(ExcelChartType chartType). L'enumerazione ExcelChartType include vari tipi di grafici predefiniti in MS Excel. Di seguito sono riportati i passaggi per aggiungere un istogramma in cluster in Excel utilizzando Spire.XLS for Python.
- Creare un oggetto cartella di lavoro.
- Ottieni un foglio di lavoro specifico tramite la proprietà Workbook.Worksheets[index].
- Scrivi i dati nelle celle specificate.
- Aggiungere un carattere di colonna in cluster al foglio di lavoro utilizzando il metodo Worksheet.Chart.Add(ExcelChartType.ColumnClustered).
- Imposta i dati del grafico tramite la proprietà Chart.DataRange.
- Imposta la posizione, il titolo e altri attributi del grafico tramite le proprietà sotto l'oggetto Grafico.
- Salva la cartella di lavoro in un file Excel utilizzando il metodo Workbook.SaveToFile().
- Python
from spire.xls import *
from spire.xls.common import *

# Create a Workbook object
workbook = Workbook()

# Get the first sheet
sheet = workbook.Worksheets[0]

# Set chart data
sheet.Range["A1"].Value = "Product"
sheet.Range["A2"].Value = "Diet Coke"
sheet.Range["A3"].Value = "Mountain Dew"
sheet.Range["A4"].Value = "Diet Pesi"
sheet.Range["A5"].Value = "Cherry Coke"

sheet.Range["B1"].Value = "Store A"
sheet.Range["B2"].NumberValue = 35000
sheet.Range["B3"].NumberValue = 46000
sheet.Range["B4"].NumberValue = 28000
sheet.Range["B5"].NumberValue = 51000
sheet.Range["C1"].Value = "Store B"
sheet.Range["C2"].NumberValue = 41000
sheet.Range["C3"].NumberValue = 32000
sheet.Range["C4"].NumberValue = 38000
sheet.Range["C5"].NumberValue = 40000

# Set cell style
sheet.Range["A1:C1"].RowHeight = 15
sheet.Range["A1:C1"].Style.Color = Color.get_Black()
sheet.Range["A1:C1"].Style.Font.Color = Color.get_White()
sheet.Range["A1:C1"].Style.VerticalAlignment = VerticalAlignType.Center
sheet.Range["A1:C1"].Style.HorizontalAlignment = HorizontalAlignType.Center
sheet.AutoFitColumn(1)

# Add a chart to the sheet
chart = sheet.Charts.Add(ExcelChartType.ColumnClustered)

# Set data range of chart
chart.DataRange = sheet.Range["A1:C5"]
chart.SeriesDataFromRange = False

# Set position of the chart
chart.LeftColumn = 5
chart.TopRow = 1
chart.RightColumn = 14
chart.BottomRow = 21

# Set chart title
chart.ChartTitle = "Store Wise Soda Soft Drink Sales"
chart.ChartTitleArea.IsBold = True
chart.ChartTitleArea.Size = 12

# Set axis title
chart.PrimaryCategoryAxis.Title = "Product"
chart.PrimaryCategoryAxis.Font.IsBold = True
chart.PrimaryCategoryAxis.TitleArea.IsBold = True
chart.PrimaryValueAxis.Title = "Sales"
chart.PrimaryValueAxis.HasMajorGridLines = False
chart.PrimaryValueAxis.TitleArea.IsBold = True
chart.PrimaryValueAxis.TitleArea.TextRotationAngle = 90

# Set series color, overlap, gap width and data labels
series = chart.Series
for i in range(len(series)):
    cs = series[i]
    cs.Format.Options.IsVaryColor = True
    cs.Format.Options.Overlap = -50
    cs.Format.Options.GapWidth = 350
    cs.DataPoints.DefaultDataPoint.DataLabels.HasValue = True

# Set legend position
chart.Legend.Position = LegendPositionType.Top

# Save the document
workbook.SaveToFile("ClusteredColumnChart.xlsx", ExcelVersion.Version2016)

Crea un istogramma in pila in Excel in Python
Il processo di creazione di un istogramma in pila è simile a quello di creazione di un istogramma raggruppato. L'unica differenza è che è necessario modificare il tipo di grafico di Excel da ColumnClustered a ColumnStacked.
- Creare un oggetto cartella di lavoro.
- Ottieni un foglio di lavoro specifico tramite la proprietà Workbook.Worksheets[index].
- Scrivi i dati nelle celle specificate.
- Aggiungere un carattere di colonna in cluster al foglio di lavoro utilizzando il metodo Worksheet.Chart.Add(ExcelChartType.ColumnStacked).
- Imposta i dati del grafico tramite la proprietà Chart.DataRange.
- Imposta la posizione, il titolo e altri attributi del grafico tramite le proprietà sotto l'oggetto Grafico.
- Salva la cartella di lavoro in un file Excel utilizzando il metodo Workbook.SaveToFile().
- Python
from spire.xls import *
from spire.xls.common import *

# Create a Workbook object
workbook = Workbook()

# Get the first sheet
sheet = workbook.Worksheets[0]

# Set chart data
sheet.Range["A1"].Value = "Product"
sheet.Range["A2"].Value = "Diet Coke"
sheet.Range["A3"].Value = "Mountain Dew"
sheet.Range["A4"].Value = "Diet Pesi"
sheet.Range["A5"].Value = "Cherry Coke"
sheet.Range["B1"].Value = "Store A"
sheet.Range["B2"].NumberValue = 35000
sheet.Range["B3"].NumberValue = 46000
sheet.Range["B4"].NumberValue = 28000
sheet.Range["B5"].NumberValue = 51000
sheet.Range["C1"].Value = "Store B"
sheet.Range["C2"].NumberValue = 41000
sheet.Range["C3"].NumberValue = 32000
sheet.Range["C4"].NumberValue = 38000
sheet.Range["C5"].NumberValue = 40000

# Set cell style
sheet.Range["A1:C1"].RowHeight = 15
sheet.Range["A1:C1"].Style.Color = Color.get_Black()
sheet.Range["A1:C1"].Style.Font.Color = Color.get_White()
sheet.Range["A1:C1"].Style.VerticalAlignment = VerticalAlignType.Center
sheet.Range["A1:C1"].Style.HorizontalAlignment = HorizontalAlignType.Center
sheet.AutoFitColumn(1)

# Add a chart to the sheet
chart = sheet.Charts.Add(ExcelChartType.ColumnStacked)

# Set data range of chart
chart.DataRange = sheet.Range["A1:C5"]
chart.SeriesDataFromRange = False

# Set position of the chart
chart.LeftColumn = 5
chart.TopRow = 1
chart.RightColumn = 14
chart.BottomRow = 21

# Set chart title
chart.ChartTitle = "Store Wise Soda Soft Drink Sales"
chart.ChartTitleArea.IsBold = True
chart.ChartTitleArea.Size = 12

# Set axis title
chart.PrimaryCategoryAxis.Title = "Product"
chart.PrimaryCategoryAxis.Font.IsBold = True
chart.PrimaryCategoryAxis.TitleArea.IsBold = True
chart.PrimaryValueAxis.Title = "Sales"
chart.PrimaryValueAxis.HasMajorGridLines = False
chart.PrimaryValueAxis.TitleArea.IsBold = True
chart.PrimaryValueAxis.TitleArea.TextRotationAngle = 90

# Set series color, gap width and data labels
series = chart.Series
for i in range(len(series)):
    cs = series[i]
    cs.Format.Options.IsVaryColor = True
    cs.Format.Options.GapWidth = 270
    cs.DataPoints.DefaultDataPoint.DataLabels.HasValue = True
    cs.DataPoints.DefaultDataPoint.DataLabels.Position = DataLabelPositionType.Inside

# Set legend position
chart.Legend.Position = LegendPositionType.Top

# Save the document
workbook.SaveToFile("StackedColumnChart.xlsx", ExcelVersion.Version2016)

Richiedi una licenza temporanea
Se desideri rimuovere il messaggio di valutazione dai documenti generati o eliminare le limitazioni della funzione, per favore richiedere una licenza di prova di 30 giorni per te.
