Table des matières
Installer avec Pip
pip install Spire.XLS
Liens connexes
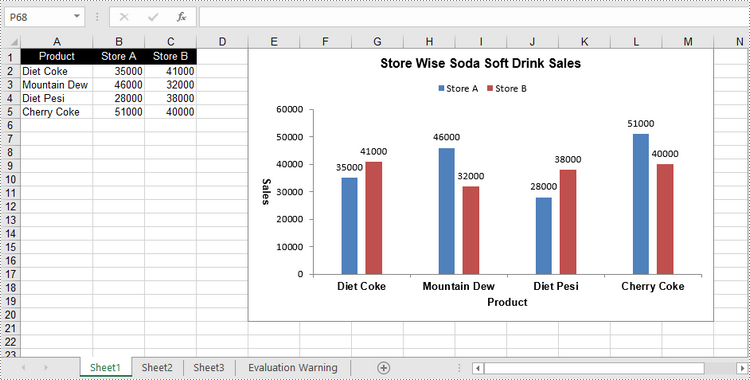
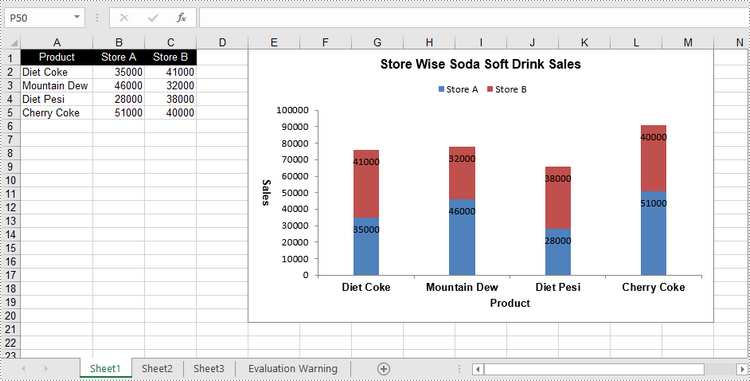
Un histogramme groupé et un histogramme empilé sont deux variantes de l'histogramme. Le diagramme à colonnes groupées permet une comparaison simple des valeurs dans différentes catégories, tandis que le diagramme à colonnes empilées affiche à la fois le total de chaque catégorie et la proportion de ses composants individuels. Dans cet article, vous apprendrez comment créer des histogrammes groupés ou empilés dans Excel en Python à l'aide de Spire.XLS for Python.
- Créer un histogramme groupé dans Excel en Python
- Créer un graphique à colonnes empilées dans Excel en Python
Installer Spire.XLS for Python
Ce scénario nécessite Spire.XLS for Python et plum-dispatch v1.7.4. Ils peuvent être facilement installés dans votre VS Code via la commande pip suivante.
pip install Spire.XLS
Si vous ne savez pas comment procéder à l'installation, veuillez vous référer à ce didacticiel: Comment installer Spire.XLS for Python dans VS Code
Créer un histogramme groupé dans Excel en Python
Pour ajouter un graphique à une feuille de calcul, utilisez la méthode Worksheet.Chart.Add(ExcelChartType chartType). L'énumération ExcelChartType comprend différents types de graphiques prédéfinis dans MS Excel. Voici les étapes pour ajouter un histogramme groupé dans Excel à l'aide de Spire.XLS for Python.
- Créez un objet Workbook.
- Obtenez une feuille de calcul spécifique via la propriété Workbook.Worksheets[index].
- Écrivez les données dans les cellules spécifiées.
- Ajoutez un caractère de colonne groupé à la feuille de calcul à l’aide de la méthode Worksheet.Chart.Add(ExcelChartType.ColumnClustered).
- Définissez les données du graphique via la propriété Chart.DataRange.
- Définissez la position, le titre et d'autres attributs du graphique via les propriétés sous l'objet Chart.
- Enregistrez le classeur dans un fichier Excel à l’aide de la méthode Workbook.SaveToFile().
- Python
from spire.xls import *
from spire.xls.common import *

# Create a Workbook object
workbook = Workbook()

# Get the first sheet
sheet = workbook.Worksheets[0]

# Set chart data
sheet.Range["A1"].Value = "Product"
sheet.Range["A2"].Value = "Diet Coke"
sheet.Range["A3"].Value = "Mountain Dew"
sheet.Range["A4"].Value = "Diet Pesi"
sheet.Range["A5"].Value = "Cherry Coke"

sheet.Range["B1"].Value = "Store A"
sheet.Range["B2"].NumberValue = 35000
sheet.Range["B3"].NumberValue = 46000
sheet.Range["B4"].NumberValue = 28000
sheet.Range["B5"].NumberValue = 51000
sheet.Range["C1"].Value = "Store B"
sheet.Range["C2"].NumberValue = 41000
sheet.Range["C3"].NumberValue = 32000
sheet.Range["C4"].NumberValue = 38000
sheet.Range["C5"].NumberValue = 40000

# Set cell style
sheet.Range["A1:C1"].RowHeight = 15
sheet.Range["A1:C1"].Style.Color = Color.get_Black()
sheet.Range["A1:C1"].Style.Font.Color = Color.get_White()
sheet.Range["A1:C1"].Style.VerticalAlignment = VerticalAlignType.Center
sheet.Range["A1:C1"].Style.HorizontalAlignment = HorizontalAlignType.Center
sheet.AutoFitColumn(1)

# Add a chart to the sheet
chart = sheet.Charts.Add(ExcelChartType.ColumnClustered)

# Set data range of chart
chart.DataRange = sheet.Range["A1:C5"]
chart.SeriesDataFromRange = False

# Set position of the chart
chart.LeftColumn = 5
chart.TopRow = 1
chart.RightColumn = 14
chart.BottomRow = 21

# Set chart title
chart.ChartTitle = "Store Wise Soda Soft Drink Sales"
chart.ChartTitleArea.IsBold = True
chart.ChartTitleArea.Size = 12

# Set axis title
chart.PrimaryCategoryAxis.Title = "Product"
chart.PrimaryCategoryAxis.Font.IsBold = True
chart.PrimaryCategoryAxis.TitleArea.IsBold = True
chart.PrimaryValueAxis.Title = "Sales"
chart.PrimaryValueAxis.HasMajorGridLines = False
chart.PrimaryValueAxis.TitleArea.IsBold = True
chart.PrimaryValueAxis.TitleArea.TextRotationAngle = 90

# Set series color, overlap, gap width and data labels
series = chart.Series
for i in range(len(series)):
    cs = series[i]
    cs.Format.Options.IsVaryColor = True
    cs.Format.Options.Overlap = -50
    cs.Format.Options.GapWidth = 350
    cs.DataPoints.DefaultDataPoint.DataLabels.HasValue = True

# Set legend position
chart.Legend.Position = LegendPositionType.Top

# Save the document
workbook.SaveToFile("ClusteredColumnChart.xlsx", ExcelVersion.Version2016)

Créer un graphique à colonnes empilées dans Excel en Python
Le processus de création d’un histogramme empilé est similaire à celui de création d’un histogramme groupé. La seule différence est que vous devez modifier le type de graphique Excel de ColumnClustered à ColumnStacked.
- Créez un objet Workbook.
- Obtenez une feuille de calcul spécifique via la propriété Workbook.Worksheets[index].
- Écrivez les données dans les cellules spécifiées.
- Ajoutez un caractère de colonne groupé à la feuille de calcul à l’aide de la méthode Worksheet.Chart.Add(ExcelChartType.ColumnStacked).
- Définissez les données du graphique via la propriété Chart.DataRange.
- Définissez la position, le titre et d'autres attributs du graphique via les propriétés sous l'objet Chart.
- Enregistrez le classeur dans un fichier Excel à l’aide de la méthode Workbook.SaveToFile().
- Python
from spire.xls import *
from spire.xls.common import *

# Create a Workbook object
workbook = Workbook()

# Get the first sheet
sheet = workbook.Worksheets[0]

# Set chart data
sheet.Range["A1"].Value = "Product"
sheet.Range["A2"].Value = "Diet Coke"
sheet.Range["A3"].Value = "Mountain Dew"
sheet.Range["A4"].Value = "Diet Pesi"
sheet.Range["A5"].Value = "Cherry Coke"
sheet.Range["B1"].Value = "Store A"
sheet.Range["B2"].NumberValue = 35000
sheet.Range["B3"].NumberValue = 46000
sheet.Range["B4"].NumberValue = 28000
sheet.Range["B5"].NumberValue = 51000
sheet.Range["C1"].Value = "Store B"
sheet.Range["C2"].NumberValue = 41000
sheet.Range["C3"].NumberValue = 32000
sheet.Range["C4"].NumberValue = 38000
sheet.Range["C5"].NumberValue = 40000

# Set cell style
sheet.Range["A1:C1"].RowHeight = 15
sheet.Range["A1:C1"].Style.Color = Color.get_Black()
sheet.Range["A1:C1"].Style.Font.Color = Color.get_White()
sheet.Range["A1:C1"].Style.VerticalAlignment = VerticalAlignType.Center
sheet.Range["A1:C1"].Style.HorizontalAlignment = HorizontalAlignType.Center
sheet.AutoFitColumn(1)

# Add a chart to the sheet
chart = sheet.Charts.Add(ExcelChartType.ColumnStacked)

# Set data range of chart
chart.DataRange = sheet.Range["A1:C5"]
chart.SeriesDataFromRange = False

# Set position of the chart
chart.LeftColumn = 5
chart.TopRow = 1
chart.RightColumn = 14
chart.BottomRow = 21

# Set chart title
chart.ChartTitle = "Store Wise Soda Soft Drink Sales"
chart.ChartTitleArea.IsBold = True
chart.ChartTitleArea.Size = 12

# Set axis title
chart.PrimaryCategoryAxis.Title = "Product"
chart.PrimaryCategoryAxis.Font.IsBold = True
chart.PrimaryCategoryAxis.TitleArea.IsBold = True
chart.PrimaryValueAxis.Title = "Sales"
chart.PrimaryValueAxis.HasMajorGridLines = False
chart.PrimaryValueAxis.TitleArea.IsBold = True
chart.PrimaryValueAxis.TitleArea.TextRotationAngle = 90

# Set series color, gap width and data labels
series = chart.Series
for i in range(len(series)):
    cs = series[i]
    cs.Format.Options.IsVaryColor = True
    cs.Format.Options.GapWidth = 270
    cs.DataPoints.DefaultDataPoint.DataLabels.HasValue = True
    cs.DataPoints.DefaultDataPoint.DataLabels.Position = DataLabelPositionType.Inside

# Set legend position
chart.Legend.Position = LegendPositionType.Top

# Save the document
workbook.SaveToFile("StackedColumnChart.xlsx", ExcelVersion.Version2016)

Demander une licence temporaire
Si vous souhaitez supprimer le message d'évaluation des documents générés ou vous débarrasser des limitations fonctionnelles, veuillez demander une licence d'essai de 30 jours pour toi.
