Tabla de contenido
Instalar con Pip
pip install Spire.XLS
enlaces relacionados
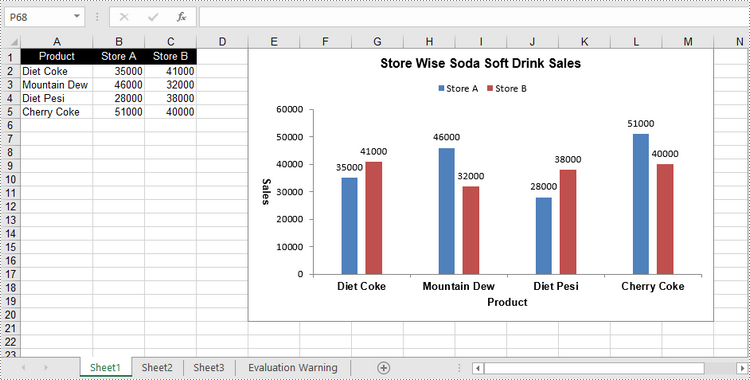
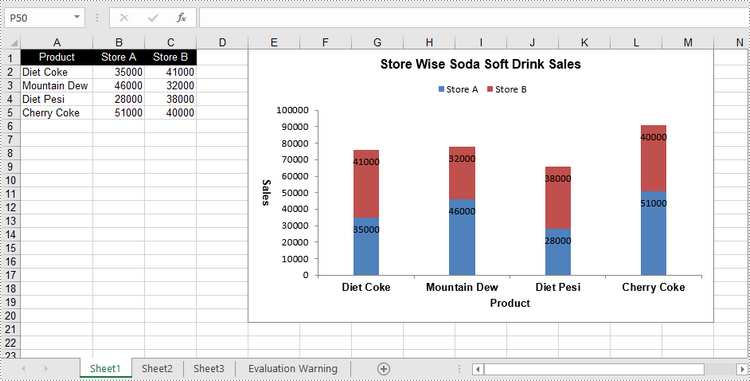
Un gráfico de columnas agrupadas y un gráfico de columnas apiladas son dos variantes del gráfico de columnas. El gráfico de columnas agrupadas permite una comparación sencilla de valores entre diferentes categorías, mientras que el gráfico de columnas apiladas muestra tanto el total de cada categoría como la proporción de sus componentes individuales. En este artículo, aprenderá cómo crear gráficos de columnas agrupadas o apiladas en Excel en Python usando Spire.XLS for Python.
- Cree un gráfico de columnas agrupadas en Excel en Python
- Cree un gráfico de columnas apiladas en Excel en Python
Instalar Spire.XLS for Python
Este escenario requiere Spire.XLS for Python y plum-dispatch v1.7.4. Se pueden instalar fácilmente en su código VS mediante el siguiente comando pip.
pip install Spire.XLS
Si no está seguro de cómo instalarlo, consulte este tutorial: Cómo instalar Spire.XLS for Python en VS Code
Cree un gráfico de columnas agrupadas en Excel en Python
Para agregar un gráfico a una hoja de trabajo, utilice el método Worksheet.Chart.Add(ExcelChartType chartType). La enumeración ExcelChartType incluye varios tipos de gráficos predefinidos en MS Excel. Los siguientes son los pasos para agregar un gráfico de columnas agrupadas en Excel usando Spire.XLS for Python.
- Cree un objeto de libro de trabajo.
- Obtenga una hoja de trabajo específica a través de la propiedad Workbook.Worksheets[index].
- Escriba datos en las celdas especificadas.
- Agregue un carácter de columna agrupada a la hoja de trabajo utilizando el método Worksheet.Chart.Add(ExcelChartType.ColumnClustered).
- Establezca los datos del gráfico a través de la propiedad Chart.DataRange.
- Establezca la posición, el título y otros atributos del gráfico a través de las propiedades bajo el objeto Gráfico.
- Guarde el libro en un archivo de Excel utilizando el método Workbook.SaveToFile().
- Python
from spire.xls import *
from spire.xls.common import *

# Create a Workbook object
workbook = Workbook()

# Get the first sheet
sheet = workbook.Worksheets[0]

# Set chart data
sheet.Range["A1"].Value = "Product"
sheet.Range["A2"].Value = "Diet Coke"
sheet.Range["A3"].Value = "Mountain Dew"
sheet.Range["A4"].Value = "Diet Pesi"
sheet.Range["A5"].Value = "Cherry Coke"

sheet.Range["B1"].Value = "Store A"
sheet.Range["B2"].NumberValue = 35000
sheet.Range["B3"].NumberValue = 46000
sheet.Range["B4"].NumberValue = 28000
sheet.Range["B5"].NumberValue = 51000
sheet.Range["C1"].Value = "Store B"
sheet.Range["C2"].NumberValue = 41000
sheet.Range["C3"].NumberValue = 32000
sheet.Range["C4"].NumberValue = 38000
sheet.Range["C5"].NumberValue = 40000

# Set cell style
sheet.Range["A1:C1"].RowHeight = 15
sheet.Range["A1:C1"].Style.Color = Color.get_Black()
sheet.Range["A1:C1"].Style.Font.Color = Color.get_White()
sheet.Range["A1:C1"].Style.VerticalAlignment = VerticalAlignType.Center
sheet.Range["A1:C1"].Style.HorizontalAlignment = HorizontalAlignType.Center
sheet.AutoFitColumn(1)

# Add a chart to the sheet
chart = sheet.Charts.Add(ExcelChartType.ColumnClustered)

# Set data range of chart
chart.DataRange = sheet.Range["A1:C5"]
chart.SeriesDataFromRange = False

# Set position of the chart
chart.LeftColumn = 5
chart.TopRow = 1
chart.RightColumn = 14
chart.BottomRow = 21

# Set chart title
chart.ChartTitle = "Store Wise Soda Soft Drink Sales"
chart.ChartTitleArea.IsBold = True
chart.ChartTitleArea.Size = 12

# Set axis title
chart.PrimaryCategoryAxis.Title = "Product"
chart.PrimaryCategoryAxis.Font.IsBold = True
chart.PrimaryCategoryAxis.TitleArea.IsBold = True
chart.PrimaryValueAxis.Title = "Sales"
chart.PrimaryValueAxis.HasMajorGridLines = False
chart.PrimaryValueAxis.TitleArea.IsBold = True
chart.PrimaryValueAxis.TitleArea.TextRotationAngle = 90

# Set series color, overlap, gap width and data labels
series = chart.Series
for i in range(len(series)):
    cs = series[i]
    cs.Format.Options.IsVaryColor = True
    cs.Format.Options.Overlap = -50
    cs.Format.Options.GapWidth = 350
    cs.DataPoints.DefaultDataPoint.DataLabels.HasValue = True

# Set legend position
chart.Legend.Position = LegendPositionType.Top

# Save the document
workbook.SaveToFile("ClusteredColumnChart.xlsx", ExcelVersion.Version2016)

Cree un gráfico de columnas apiladas en Excel en Python
El proceso de creación de un gráfico de columnas apiladas es similar al de creación de un gráfico de columnas agrupadas. La única diferencia es que debe cambiar el tipo de gráfico de Excel de ColumnClustered a ColumnStacked.
- Cree un objeto de libro de trabajo.
- Obtenga una hoja de trabajo específica a través de la propiedad Workbook.Worksheets[index].
- Escriba datos en las celdas especificadas.
- Agregue un carácter de columna agrupada a la hoja de trabajo utilizando el método Worksheet.Chart.Add(ExcelChartType.ColumnStacked).
- Establezca los datos del gráfico a través de la propiedad Chart.DataRange.
- Establezca la posición, el título y otros atributos del gráfico a través de las propiedades bajo el objeto Gráfico.
- Guarde el libro en un archivo de Excel utilizando el método Workbook.SaveToFile().
- Python
from spire.xls import *
from spire.xls.common import *

# Create a Workbook object
workbook = Workbook()

# Get the first sheet
sheet = workbook.Worksheets[0]

# Set chart data
sheet.Range["A1"].Value = "Product"
sheet.Range["A2"].Value = "Diet Coke"
sheet.Range["A3"].Value = "Mountain Dew"
sheet.Range["A4"].Value = "Diet Pesi"
sheet.Range["A5"].Value = "Cherry Coke"
sheet.Range["B1"].Value = "Store A"
sheet.Range["B2"].NumberValue = 35000
sheet.Range["B3"].NumberValue = 46000
sheet.Range["B4"].NumberValue = 28000
sheet.Range["B5"].NumberValue = 51000
sheet.Range["C1"].Value = "Store B"
sheet.Range["C2"].NumberValue = 41000
sheet.Range["C3"].NumberValue = 32000
sheet.Range["C4"].NumberValue = 38000
sheet.Range["C5"].NumberValue = 40000

# Set cell style
sheet.Range["A1:C1"].RowHeight = 15
sheet.Range["A1:C1"].Style.Color = Color.get_Black()
sheet.Range["A1:C1"].Style.Font.Color = Color.get_White()
sheet.Range["A1:C1"].Style.VerticalAlignment = VerticalAlignType.Center
sheet.Range["A1:C1"].Style.HorizontalAlignment = HorizontalAlignType.Center
sheet.AutoFitColumn(1)

# Add a chart to the sheet
chart = sheet.Charts.Add(ExcelChartType.ColumnStacked)

# Set data range of chart
chart.DataRange = sheet.Range["A1:C5"]
chart.SeriesDataFromRange = False

# Set position of the chart
chart.LeftColumn = 5
chart.TopRow = 1
chart.RightColumn = 14
chart.BottomRow = 21

# Set chart title
chart.ChartTitle = "Store Wise Soda Soft Drink Sales"
chart.ChartTitleArea.IsBold = True
chart.ChartTitleArea.Size = 12

# Set axis title
chart.PrimaryCategoryAxis.Title = "Product"
chart.PrimaryCategoryAxis.Font.IsBold = True
chart.PrimaryCategoryAxis.TitleArea.IsBold = True
chart.PrimaryValueAxis.Title = "Sales"
chart.PrimaryValueAxis.HasMajorGridLines = False
chart.PrimaryValueAxis.TitleArea.IsBold = True
chart.PrimaryValueAxis.TitleArea.TextRotationAngle = 90

# Set series color, gap width and data labels
series = chart.Series
for i in range(len(series)):
    cs = series[i]
    cs.Format.Options.IsVaryColor = True
    cs.Format.Options.GapWidth = 270
    cs.DataPoints.DefaultDataPoint.DataLabels.HasValue = True
    cs.DataPoints.DefaultDataPoint.DataLabels.Position = DataLabelPositionType.Inside

# Set legend position
chart.Legend.Position = LegendPositionType.Top

# Save the document
workbook.SaveToFile("StackedColumnChart.xlsx", ExcelVersion.Version2016)

Solicitar una licencia temporal
Si desea eliminar el mensaje de evaluación de los documentos generados o deshacerse de las limitaciones de la función, por favor solicitar una licencia de prueba de 30 días para ti.
