Table of Contents
Install with Pip
pip install Spire.XLS
Related Links
Conditional formatting is a feature in Microsoft Excel that enables you to apply formatting rules to cells based on specific conditions or criteria. These conditions can be based on cell values, formulas, or other specified criteria. Conditional formatting allows you to dynamically change the appearance of cells, such as font color, cell background color, borders, and data bars, to visually highlight or emphasize certain data points. In this blog, we will explore how to apply conditional formatting to Excel using Python.
We will discuss some commonly used types of conditional formatting rules in Excel:
Python Library to Apply Conditional Formatting to Excel
To apply conditional formatting to Excel files using Python, we need to install a Python module that supports this functionality. In this blog post, we will use the Spire.XLS for Python library, which offers a comprehensive set of functions and properties specifically designed for applying conditional formatting rules to Excel files based on various criteria like cell values, formulas, and more.
To install Spire.XLS for Python, you can run the following pip command:
pip install Spire.XLS
Highlight Cell Rules
Highlight Cell Rules are a type of conditional formatting in Excel that allows you to highlight cells based on their values. You can set conditions such as greater than, less than, equal to, between, and more to determine which cells should be formatted. You can choose formatting options like font color, background color, and borders.
Here is an example that shows how to highlight cells containing values greater or less than a specific value in Excel using Python and Spire.XLS for Python:
- Python
from spire.xls import *
from spire.xls.common import *

# Create an object of the Workbook class
workbook = Workbook()
# Load an Excel file
workbook.LoadFromFile("Example1.xlsx")
# Get the first worksheet
sheet = workbook.Worksheets[0]

# Add a conditional format to the sheet
conditionalFormat = sheet.ConditionalFormats.Add()
# Specify the cell range to apply the conditional format
conditionalFormat.AddRange(sheet.Range["C2:C11"])

# Create the first condition to highlight cells containing values greater than a specific value
condition1 = conditionalFormat.AddCondition()
condition1.FormatType = ConditionalFormatType.CellValue
condition1.FirstFormula = "90"
condition1.Operator = ComparisonOperatorType.Greater
condition1.BackColor = Color.get_Yellow()

# Create the second condition to highlight cells containing values less than a specific value
condition2 = conditionalFormat.AddCondition()
condition2.FormatType = ConditionalFormatType.CellValue
condition2.FirstFormula = "80"
condition2.Operator = ComparisonOperatorType.Less
condition2.BackColor = Color.get_LightGreen()

# Save the result file
workbook.SaveToFile("HighlightCellRules.xlsx", ExcelVersion.Version2016)
workbook.Dispose()
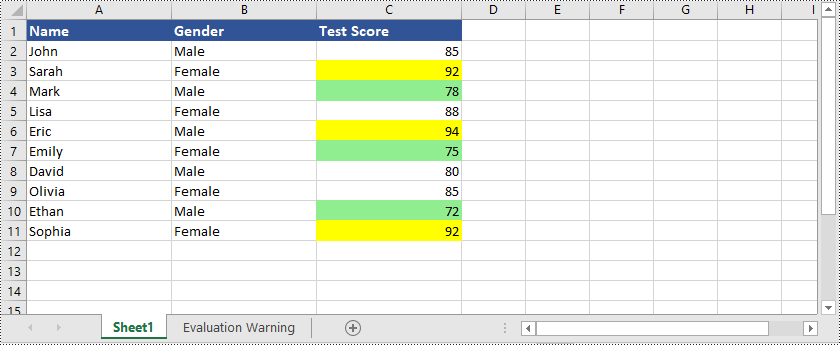
In addition to highlighting cells with values that are greater or less than a specific value, Spire.XLS for Python also supports many other options, for example, you can highlight cells with duplicate or unique values, highlight cells with dates that fall within a specified time period, and many more.
Here is an example that shows how to highlight cells with duplicate or unique values in Excel using Python and Spire.XLS for Python:
- Python
from spire.xls import *
from spire.xls.common import *

# Create an object of the Workbook class
workbook = Workbook()
# Load an Excel file
workbook.LoadFromFile("Example1.xlsx")
# Get the first worksheet
sheet = workbook.Worksheets[0]

# Add a conditional format to the worksheet
conditionalFormat = sheet.ConditionalFormats.Add()
# Specify the cell range to apply the conditional format
conditionalFormat.AddRange(sheet.Range["C2:C11"])

# Create the first condition to highlight cells containing duplicate values
condition1 = conditionalFormat.AddCondition()
condition1.FormatType = ConditionalFormatType.DuplicateValues
condition1.BackColor = Color.get_IndianRed()

# Create the second condition to highlight cells containing unique values
condition2 = conditionalFormat.AddCondition()
condition2.FormatType = ConditionalFormatType.UniqueValues
condition2.BackColor = Color.get_Yellow()

# Save the result file
workbook.SaveToFile("HighlightCellRules.xlsx", ExcelVersion.Version2016)
workbook.Dispose()
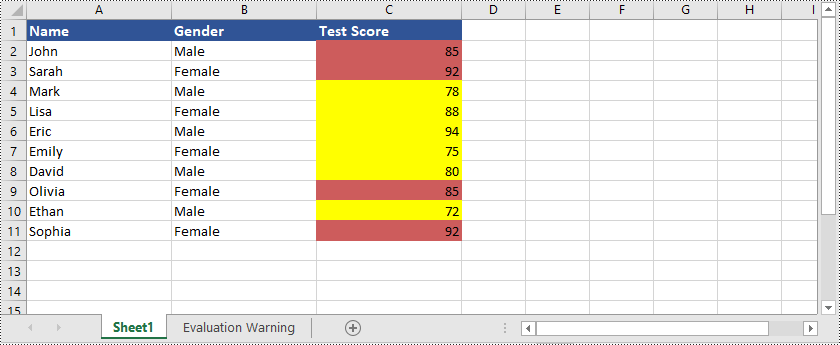
Here is an example that shows how to highlight cells with dates that fall within a specific time period in Excel using Python and Spire.XLS for Python:
- Python
from spire.xls import *
from spire.xls.common import *

# Create an object of the Workbook class
workbook = Workbook()
# Load an Excel file
workbook.LoadFromFile("Example2.xlsx")
# Get the first worksheet
sheet = workbook.Worksheets[0]

# Add a conditional format to the worksheet
conditionalFormat = sheet.ConditionalFormats.Add()
# Specify the cell range to apply the conditional format
conditionalFormat.AddRange(sheet.Range["B2:B9"])

# Create a condition to highlight cells with dates that fall within a specific time period
condition = conditionalFormat.AddTimePeriodCondition(TimePeriodType.Last7Days)
condition.BackColor = Color.get_Yellow()

# Save the result file
workbook.SaveToFile("HighlightCellRules.xlsx", ExcelVersion.Version2016)
workbook.Dispose()
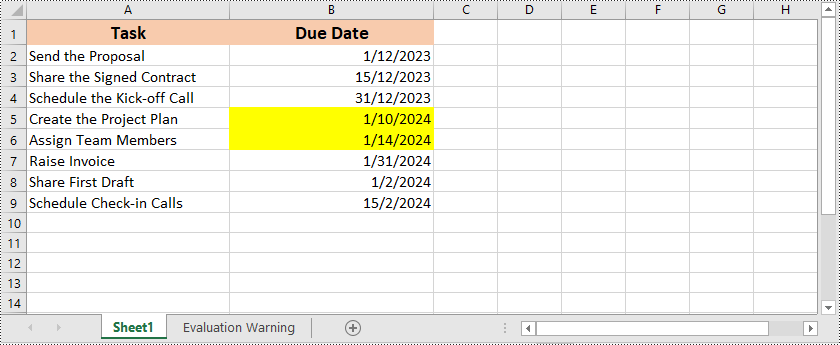
Top or Bottom Rules
Top/Bottom Rules are another type of conditional formatting in Excel that enables you to highlight cells containing the highest or lowest values within a range. You can specify the number of top or bottom values to highlight, and Excel will automatically apply the formatting based on the selected rule.
Here is an example that shows how to highlight cells containing the top or bottom ranked values in Excel using Python and Spire.XLS for Python:
- Python
from spire.xls import *
from spire.xls.common import *

# Create an object of the Workbook class
workbook = Workbook()
# Load an Excel file
workbook.LoadFromFile("Example1.xlsx")
# Get the first worksheet
sheet = workbook.Worksheets[0]

# Add a conditional format to the worksheet
conditionalFormat = sheet.ConditionalFormats.Add()
# Specify the cell range to apply the conditional format
conditionalFormat.AddRange(sheet.Range["C2:C11"])

# Add the first condition to highlight the top 2 ranked values
condition1 = conditionalFormat.AddTopBottomCondition(TopBottomType.Top, 2)
condition1.BackColor = Color.get_MediumPurple()

# Add the second condition to highlight the bottom 2 ranked values
condition2 = conditionalFormat.AddTopBottomCondition(TopBottomType.Bottom, 2)
condition2.BackColor = Color.get_LightBlue()

# Save the result file
workbook.SaveToFile("TopOrBottomRules.xlsx", ExcelVersion.Version2016)
workbook.Dispose()
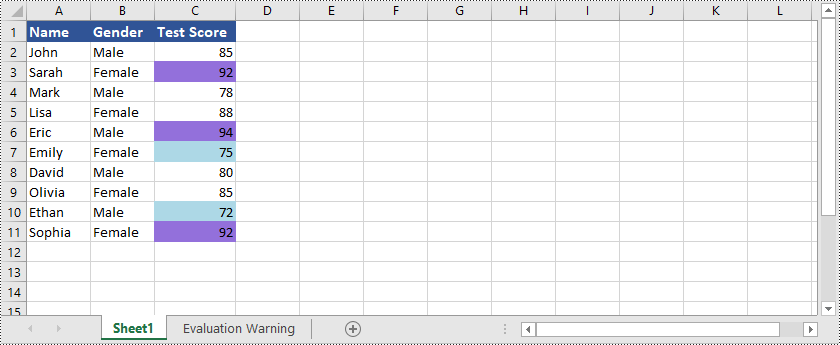
In addition to highlighting cells containing the top or bottom ranked values, Spire.XLS for Python is also capable of highlighting cells with values above or below the average value in Excel. You can refer to the following example:
- Python
from spire.xls import *
from spire.xls.common import *

# Create an object of the Workbook class
workbook = Workbook()
# Load an Excel file
workbook.LoadFromFile("Example1.xlsx")
# Get the first worksheet
sheet = workbook.Worksheets[0]

# Add a conditional format to the worksheet
conditionalFormat1 = sheet.ConditionalFormats.Add()
# Specify the cell range to apply the conditional format
conditionalFormat1.AddRange(sheet.Range["C2:C11"])

# Create a condition to highlight cells with values below the average
condition1 = conditionalFormat1.AddAverageCondition(AverageType.Below)
condition1.BackColor = Color.get_SkyBlue()

# Add a conditional format to the worksheet
conditionalFormat2 = sheet.ConditionalFormats.Add()
# Specify the cell range to apply the conditional format
conditionalFormat2.AddRange(sheet.Range["C2:C11"])

# Create a condition to highlight cells with values above the average
condition2 = conditionalFormat2.AddAverageCondition(AverageType.Above)
condition2.BackColor = Color.get_Orange()

# Save the result file
workbook.SaveToFile("HighlightValuesAboveOrBelowAverage.xlsx", ExcelVersion.Version2016)
workbook.Dispose()
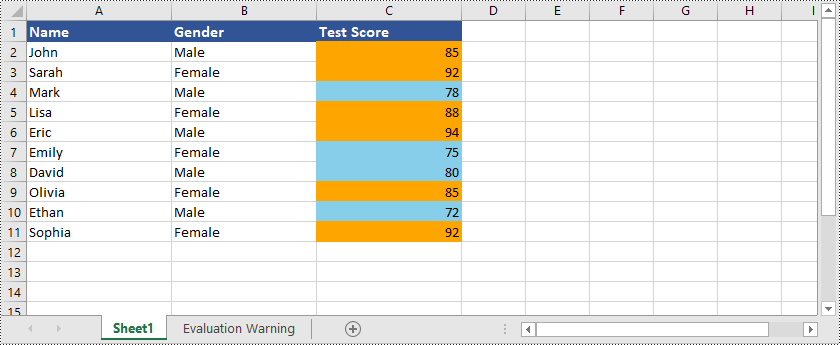
Data Bars
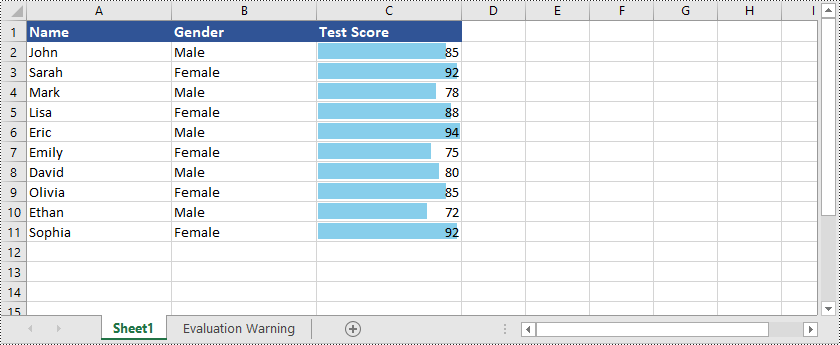
Data Bars are a visual representation of conditional formatting in Excel. They create horizontal bars within cells that visually represent the relative values of the data. The length of the bar corresponds to the value in the cell, allowing for easy comparison of data points.
Here is an example that shows how to create data bars in Excel using Python and Spire.XLS for Python:
- Python
from spire.xls import *
from spire.xls.common import *

# Create an object of the Workbook class
workbook = Workbook()
# Load an Excel file
workbook.LoadFromFile("Example1.xlsx")
# Get the first worksheet
sheet = workbook.Worksheets[0]

# Add a conditional format to the worksheet
conditionalFormat = sheet.ConditionalFormats.Add()
# Specify the cell range to apply the conditional format
conditionalFormat.AddRange(sheet.Range["C2:C11"])

# Add a condition and set its format type to DataBar
condition = conditionalFormat.AddCondition()
condition.FormatType = ConditionalFormatType.DataBar
# Set fill effect for data bars
# condition.DataBar.BarFillType = DataBarFillType.DataBarFillGradient
# Set bar color
condition.DataBar.BarColor = Color.get_SkyBlue()

# Save the result file
workbook.SaveToFile("DataBars.xlsx", ExcelVersion.Version2016)
workbook.Dispose()
Color Scales
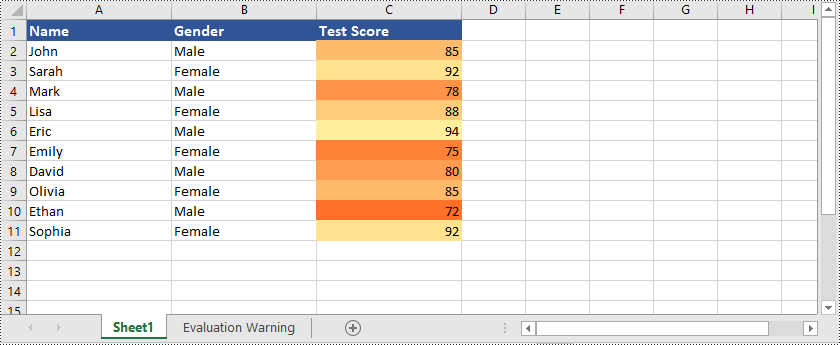
Color Scales are a type of conditional formatting that applies color gradients to cells based on their values. Excel uses a range of colors to represent the distribution of values within a selected range of cells. Higher values are assigned one color, while lower values are assigned another color, with shades in between for intermediate values. Color Scales provide a visual representation of the data distribution, allowing you to easily identify high and low values, as well as the relative positioning of values within the data set.
Here is an example that shows how to create color scales in Excel using Python and Spire.XLS for Python:
- Python
from spire.xls import *
from spire.xls.common import *

# Create an object of the Workbook class
workbook = Workbook()
# Load an Excel file
workbook.LoadFromFile("Example1.xlsx")
# Get the first worksheet
sheet = workbook.Worksheets[0]

# Add a conditional format to the worksheet
conditionalFormat = sheet.ConditionalFormats.Add()
# Specify the cell range to apply the conditional format
conditionalFormat.AddRange(sheet.Range["C2:C11"])

# Add a condition and set its format type to ColorScale
condition = conditionalFormat.AddCondition()
condition.FormatType = ConditionalFormatType.ColorScale

# Save the result file
workbook.SaveToFile("ColorScales.xlsx", ExcelVersion.Version2016)
workbook.Dispose()
Icon Sets
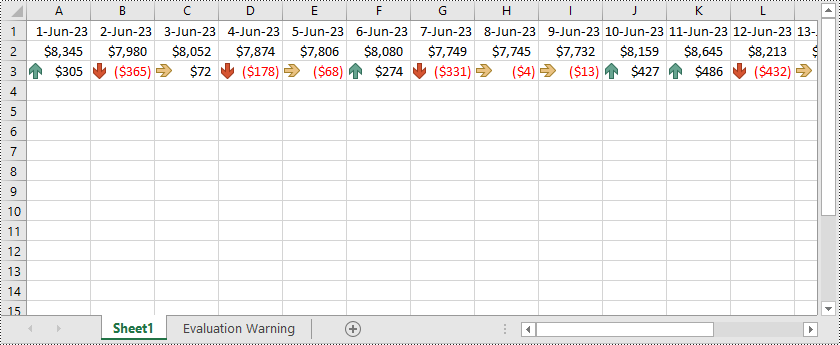
Icon Sets are a type of conditional formatting that uses visual icons, such as arrows, symbols, or traffic lights, to represent different conditions or values within cells. Excel provides predefined sets of icons that you can apply based on specific criteria or value ranges. For example, you can use arrow icons to indicate whether values are increasing or decreasing, or use traffic light icons to represent the status of certain metrics. Icon Sets offer a visually intuitive way to interpret and compare data based on the assigned icons.
Here is an example that shows how to create icon sets in Excel using Python and Spire.XLS for Python:
- Python
from spire.xls import *
from spire.xls.common import *

# Create an object of the Workbook class
workbook = Workbook()
# Load an Excel file
workbook.LoadFromFile("Example3.xlsx")
# Get the first worksheet
sheet = workbook.Worksheets[0]

# Add a conditional format to the worksheet
conditionalFormat = sheet.ConditionalFormats.Add()
# Specify the cell range to apply the conditional format
conditionalFormat.AddRange(sheet.Range["A3:R3"])

# Add a condition and set its format type to IconSet
condition = conditionalFormat.AddCondition()
condition.FormatType = ConditionalFormatType.IconSet
# Set the type of icon sets to ThreeArrows
condition.IconSet.IconSetType = IconSetType.ThreeArrows

# Save the result file
workbook.SaveToFile("IconSets.xlsx", ExcelVersion.Version2013)
workbook.Dispose()
Formula-Based Rules
Formula-based conditional formatting gives you the flexibility to create custom rules using formulas. You can define complex conditions by utilizing functions, operators, and cell references. This allows for highly tailored formatting based on specific calculations or comparisons.
Here is an example that shows how to apply formula-based conditional formatting to Excel using Python and Spire.XLS for Python:
- Python
from spire.xls import *
from spire.xls.common import *

# Create an object of the Workbook class
workbook = Workbook()
# Load an Excel file
workbook.LoadFromFile("Example1.xlsx")
# Get the first worksheet
sheet = workbook.Worksheets[0]

# Add a conditional format to the worksheet
conditionalFormat = sheet.ConditionalFormats.Add()
# Specify the cell range to apply the conditional format
conditionalFormat.AddRange(sheet.Range["A2:C11"])

# Add a condition and set its format type to Formula
condition = conditionalFormat.AddCondition()
condition.FormatType = ConditionalFormatType.Formula
condition.FirstFormula = "=MOD(ROW(),2)=1"
condition.BackColor = Color.get_LightGray()

# Save the result file
workbook.SaveToFile("FormulaBasedRules.xlsx", ExcelVersion.Version2016)
workbook.Dispose()

Get a Free License
To fully experience the capabilities of Spire.XLS for Python without any evaluation limitations, you can request a free 30-day trial license.
Conclusion
This blog explained how to apply different types of conditional formatting to Excel using Spire.XLS for Python. If you have any questions, please feel free to post them on our forum or send them to our support team via email.
