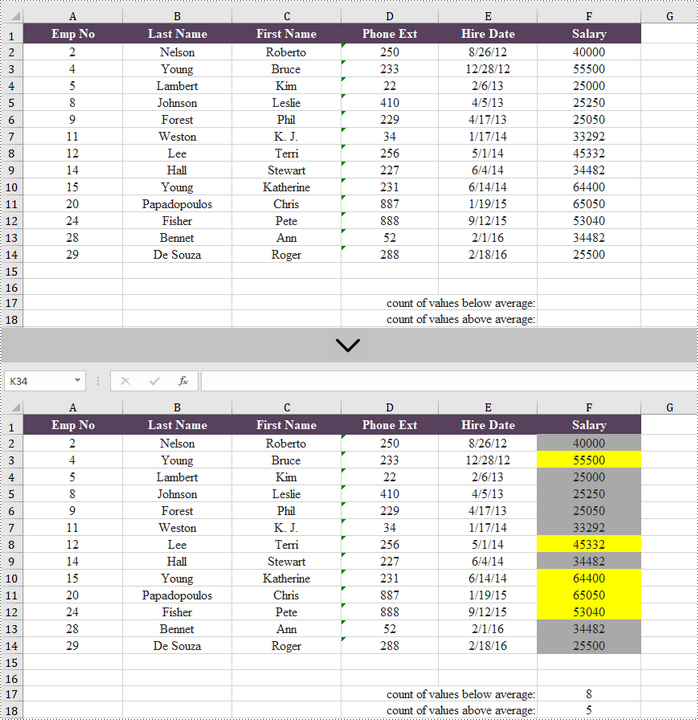
If you want to find values that are higher or lower than the average, you don't have to calculate the average, and then check those that are higher or lower. Using conditional formatting in Excel, you can automatically highlight those numbers. In this article, you will learn how to highlight values above average or below average with conditional formatting, by using Spire.XLS for .NET.
Install Spire.XLS for .NET
To begin with, you need to add the DLL files included in the Spire.XLS for .NET package as references in your .NET project. The DLL files can be either downloaded from this link or installed via NuGet.
PM> Install-Package Spire.XLS
Highlight Values Above or Below Average in Excel
Below are the steps to highlight values above or below average in Excel using Spire.XLS for .NET.
- Create a Workbook object.
- Load an Excel file using Workbook.LoadFromFile() method.
- Get a specific worksheet from the workbook through Workbook.Worsheets[index] property.
- Add a conditional formatting to the worksheet using Worksheet.ConditionalFormats.Add() method and return an object of XlsConditionalFormats class.
- Set the cell range where the conditional formatting will be applied using XlsConditionalFormats.AddRange() method.
- Add an average condition using XlsConditionalFormats.AddAverageCondition() method, specify the average type to above and change the background color of the cells that meet the condition to yellow.
- Add another average condition to change the background color of the below average values to dark gray.
- Save the workbook to an Excel file using Workbook.SaveToFile() method.
- C#
- VB.NET
using Spire.Xls;
using Spire.Xls.Core;
using Spire.Xls.Core.Spreadsheet.Collections;
using System.Drawing;

namespace HighlightValuesAboveAndBelowAverage
{
    class Program
    {
        static void Main(string[] args)
        {
            //Create a Workbook object
            Workbook workbook = new Workbook();

            //Load an Excel file
            workbook.LoadFromFile(@"C:\Users\Administrator\Desktop\sample.xlsx");

            //Get the first worksheet
            Worksheet sheet = workbook.Worksheets[0];

            //Add a conditional format to the worksheet
            XlsConditionalFormats format = sheet.ConditionalFormats.Add();

            //Set the range where the conditional format will be applied
            format.AddRange(sheet.Range["F2:F14"]);

            //Add a condition to highlight the top 2 ranked values
            IConditionalFormat condition1 = format.AddAverageCondition(AverageType.Above);
            condition1.BackColor = Color.Yellow;

            //Add a condition to highlight the bottom 2 ranked values
            IConditionalFormat condition2 = format.AddAverageCondition(AverageType.Below);
            condition2.BackColor = Color.DarkGray;

            //Get the count of values below average
            sheet.Range["F17"].Formula = "=COUNTIF(F2:F14,\"<\"&AVERAGE(F2:F14))";

            //Get the count of values above average
            sheet.Range["F18"].Formula = "=COUNTIF(F2:F14,\">\"&AVERAGE(F2:F14))";

            //Save the workbook to an Excel file
            workbook.SaveToFile("HighlightValues.xlsx", ExcelVersion.Version2016);
        }
    }
}

Apply for a Temporary License
If you'd like to remove the evaluation message from the generated documents, or to get rid of the function limitations, please request a 30-day trial license for yourself.

