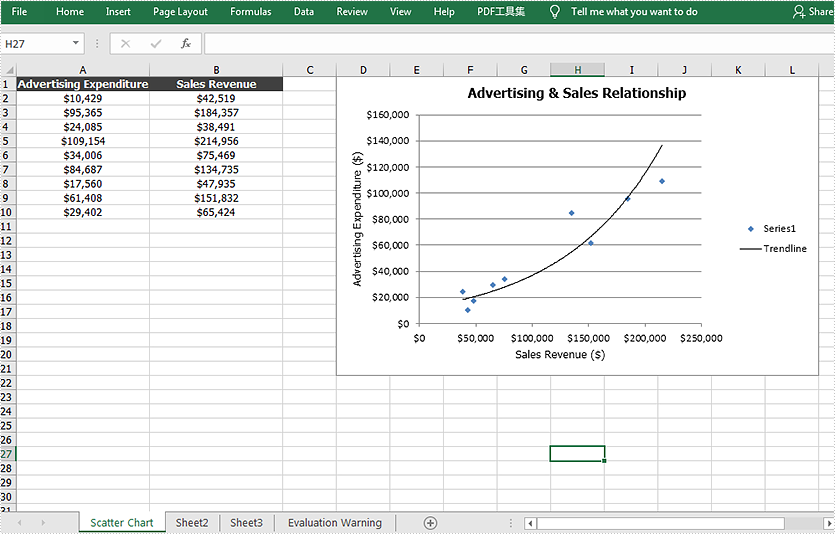
This article demonstrates how to create a scatter chart and add a trendline to it in an Excel document by using Spire.XLS for Java.
import com.spire.xls.*;
import com.spire.xls.core.IChartTrendLine;

import java.awt.*;

public class ScatterChart {
    public static void main(String[] args) {

        //Create a a Workbook object and get the first worksheet
        Workbook workbook = new Workbook();
        Worksheet sheet = workbook.getWorksheets().get(0);

        //Rename the first worksheet and set the column width
        sheet.getCellRange("A1:B1").setColumnWidth(22f);;
        sheet.setName("Scatter Chart");

        //Insert data
        sheet.getCellRange("A1").setValue("Advertising Expenditure");
        sheet.getCellRange("A2").setValue("10429");
        sheet.getCellRange("A3").setValue("95365");
        sheet.getCellRange("A4").setValue("24085");
        sheet.getCellRange("A5").setValue("109154");
        sheet.getCellRange("A6").setValue("34006");
        sheet.getCellRange("A7").setValue("84687");
        sheet.getCellRange("A8").setValue("17560");
        sheet.getCellRange("A9").setValue ("61408");
        sheet.getCellRange("A10").setValue ("29402");

        sheet.getCellRange("B1").setValue("Sales Revenue");
        sheet.getCellRange("B2").setValue ("42519");
        sheet.getCellRange("B3").setValue("184357");
        sheet.getCellRange("B4").setValue ("38491");
        sheet.getCellRange("B5").setValue ("214956");
        sheet.getCellRange("B6").setValue ("75469");
        sheet.getCellRange("B7").setValue ("134735");
        sheet.getCellRange("B8").setValue("47935");
        sheet.getCellRange("B9").setValue ("151832");
        sheet.getCellRange("B10").setValue ("65424");

        //Set cell style
        sheet.getCellRange("A1:B1").getStyle().getFont().isBold(true);
        sheet.getCellRange("A1:B1").getStyle().setColor(Color.darkGray);
        sheet.getCellRange("A1:B1").getCellStyle().getExcelFont().setColor(Color.white);
        sheet.getCellRange("A1:B10").getStyle().setHorizontalAlignment(HorizontalAlignType.Center);
        sheet.getCellRange("A2:B10").getCellStyle().setNumberFormat("\"$\"#,##0") ;


        //Create a scatter chart and set its data range
        Chart chart = sheet.getCharts().add(ExcelChartType.ScatterMarkers);
        chart.setDataRange(sheet.getCellRange("B2:B10"));
        chart.setSeriesDataFromRange(false);

        //Set position of the chart.
        chart.setLeftColumn(4);
        chart.setTopRow(1);
        chart.setRightColumn(13);
        chart.setBottomRow(22);

        //Set chart title and series data label
        chart.setChartTitle("Advertising & Sales Relationship");
        chart.getChartTitleArea().isBold(true);
        chart.getChartTitleArea().setSize(12);
        chart.getSeries().get(0).setCategoryLabels(sheet.getCellRange("B2:B10"));
        chart.getSeries().get(0).setValues(sheet.getCellRange("A2:A10"));

        //Add a trendline
        IChartTrendLine trendLine = chart.getSeries().get(0).getTrendLines().add(TrendLineType.Exponential);
        trendLine.setName("Trendline");

        //Set title of  the x and y axis
        chart.getPrimaryValueAxis().setTitle("Advertising Expenditure ($)");
        chart.getPrimaryCategoryAxis().setTitle("Sales Revenue ($)");

        //Save the document
        workbook.saveToFile("ScatterChart.xlsx",ExcelVersion.Version2010);
        workbook.dispose();
    }
}


