Python: Extract Tables from PowerPoint Presentations
PowerPoint presentations often serve as repositories of essential data and information shared during meetings, lectures, and conferences. They frequently include tables for data presentation and basic analysis. However, to further analyze the data or integrate it into reports and spreadsheets, it becomes necessary to extract these tables and save them in other formats. By leveraging Python, users can efficiently extract tables from PowerPoint presentations, transforming static slides into dynamic data sets ready for processing.
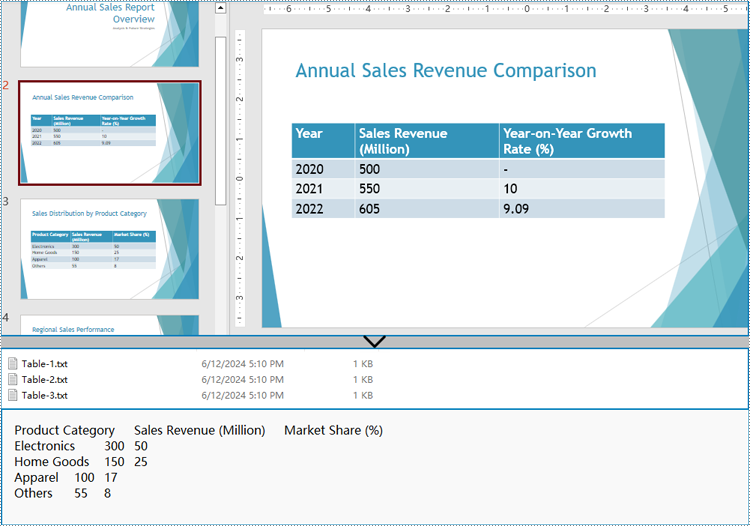
This article aims to demonstrate how to extract tables from PowerPoint presentations and write them to text and Excel worksheets using Spire.Presentation for Python, thereby enhancing the utilization of data in presentations and streamlining the data extraction process.
- Extract Table Data from PowerPoint Presentations to Text Files
- Extract Table Data from PowerPoint Presentations to Excel Worksheets
Install Spire.Presentation for Python
This scenario requires Spire.Presentation for Python and plum-dispatch v1.7.4. They can be easily installed in your Windows through the following pip command.
pip install Spire.Presentation
If you are unsure how to install, please refer to: How to Install Spire.Presentation for Python on Windows
Extract Table Data from PowerPoint Presentations to Text Files
Spire.Presentation for Python provides the ITable class which represents a table in a presentation slide. By iterating through the shapes in each slide to check if it’s an instance of ITable class, developers can retrieve all the tables in the presentation file and get the data in the tables.
The detailed steps for extracting tables from PowerPoint presentations and writing them to text files are as follows:
- Create an instance of Presentation class and load a PowerPoint file using Presentation.LoadFromFile() method.
- Iterate through all the slides in the file and then all the shapes in the slides.
- Check if a shape is an instance of ITable class. If it is, iterate through the rows and then the cells in each row. Get the cell values using TableRow[].TextFrame.Text property and append them to strings.
- Write the table data to text files.
- Python
from spire.presentation import *
from spire.presentation.common import *

# Create an instance of Presentation
presentation = Presentation()

# Load a PowerPoint file
presentation.LoadFromFile("Sample.pptx")

tables = []
# Iterate through all the slides
for slide in presentation.Slides:
    # Iterate through all the shapes
    for shape in slide.Shapes:
        # Check whether the shape is a table
        if isinstance(shape, ITable):
            tableData = ""
            # Iterate through all the rows
            for row in shape.TableRows:
                rowData = ""
                # Iterate through all the cells in the row
                for i in range(0, row.Count):
                    # Get the cell value
                    cellValue = row[i].TextFrame.Text
                    rowData += (cellValue + "\t" if i < row.Count - 1 else cellValue)
                tableData += (rowData + "\n")
            tables.append(tableData)

# Write the tables to text files
for idx, table in enumerate(tables, start=1):
    fileName = f"output/Tables/Table-{idx}.txt"
    with open(fileName, "w") as f:
        f.write(table)
presentation.Dispose()
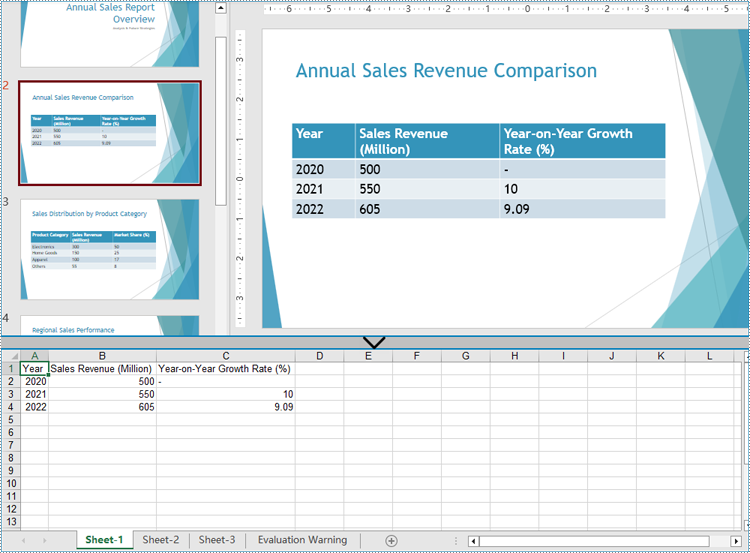
Extract Table Data from PowerPoint Presentations to Excel Worksheets
After extracting table data from presentations using Spire.Presentation for Python, developers can further utilize Spire.XLS for Python to write this data into Excel worksheets, facilitating further analysis, referencing, and format conversion.
Install Spire.XLS for Python via PyPI:
pip install Spire.XLS
The detailed steps for extracting tables from PowerPoint presentations and writing them to Excel worksheets are as follows:
- Create an instance of Presentation class and load a PowerPoint file using Presentation.LoadFromFile() method.
- Create an instance of Workbook class and clear the default worksheets.
- Iterate through the slides in the presentation and then the shapes in the slides to check if the shapes are instances of ITable class. Append all the ITable instances to a list.
- Iterate through the tables in the list and add a worksheet to the workbook for each table using Workbook.Worksheets.Add() method.
- Iterate through the rows of each table and then the cells in the rows to get the cell values through TableRow.TextFrame.Text property. Write the values to the corresponding cells in the worksheet through Worksheet.Range[].Value property.
- Save the workbook using Workbook.SaveToFile() method.
- Python
from spire.presentation import *
from spire.presentation.common import *
from spire.xls import *
from spire.xls.common import *

# Create an instance of Presentation
presentation = Presentation()

# Load a PowerPoint file
presentation.LoadFromFile("Sample.pptx")

# Create an Excel file and clear the default worksheets
workbook = Workbook()
workbook.Worksheets.Clear()

tables = []
# Iterate through all the slides
for slide in presentation.Slides:
    # Iterate through all the shapes
    for shape in slide.Shapes:
        # Check whether the shape is a table
        if isinstance(shape, ITable):
            tables.append(shape)

# Iterate through all the tables
for t in range(len(tables)):
    table = tables[t]
    sheet = workbook.Worksheets.Add(f"Sheet-{t+1}")
    for i in range(0, table.TableRows.Count):
        row = table.TableRows[i]
        for j in range(0, row.Count):
            sheet.Range[i + 1, j + 1].Value = row[j].TextFrame.Text
    # Autofit rows and columns
    sheet.AllocatedRange.AutoFitColumns()
    sheet.AllocatedRange.AutoFitRows()

# Save the Excel file
workbook.SaveToFile("output/PresentationTables.xlsx", FileFormat.Version2016)

presentation.Dispose()
workbook.Dispose()
Apply for a Temporary License
If you'd like to remove the evaluation message from the generated documents, or to get rid of the function limitations, please request a 30-day trial license for yourself.
Python: Set or Remove Table Borders in PowerPoint
Table borders in PowerPoint refer to the visible lines or outlines that surround the cells within a table. These borders provide a visual separation between cells and help define the boundaries of the table. By setting or modifying table borders, you can customize the appearance of tables in your PowerPoint presentations. In this article, we will guide you on how to set and remove table borders in PowerPoint in Python using Spire.Presentation for Python.
Install Spire.Presentation for Python
This scenario requires Spire.Presentation for Python and plum-dispatch v1.7.4. They can be easily installed in your Windows through the following pip command.
pip install Spire.Presentation
If you are unsure how to install, please refer to this tutorial: How to Install Spire.Presentation for Python on Windows
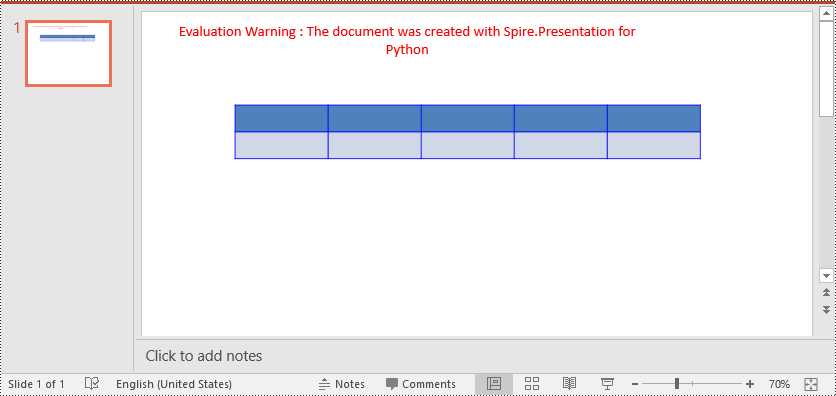
Set Table Borders in PowerPoint in Python
Spire.Presentation for Python provides the ITable.SetTableBorder() method, which allows you to set borders for a table in PowerPoint. The detailed steps are as follows.
- Create an object of the Presentation class.
- Get the first slide of the presentation using Presentation.Slides[] property.
- Add a table to the slide using ISlide.Shapes.AppendTable() method.
- Add borders to the table and set the border type, width, and color using ITable.SetTableBorder() method.
- Save the result presentation using Presentation.SaveToFile() method.
- Python
from spire.presentation.common import *
from spire.presentation import *

# Create a Presentation object
presentation = Presentation()
# Get  the first slide of the presentation
slide = presentation.Slides[0]

# Specify the number and size of rows and columns in table
widths = [100, 100, 100, 100, 100]
heights = [20, 20]

# Add a table to the first slide
table = slide.Shapes.AppendTable(100, 100, widths, heights)

# Add borders to the table and set the border type, width, and color
table.SetTableBorder(TableBorderType.All, 1, Color.get_Blue())

# Save the result presentation
presentation.SaveToFile("SetBorders.pptx", FileFormat.Pptx2013)
presentation.Dispose()
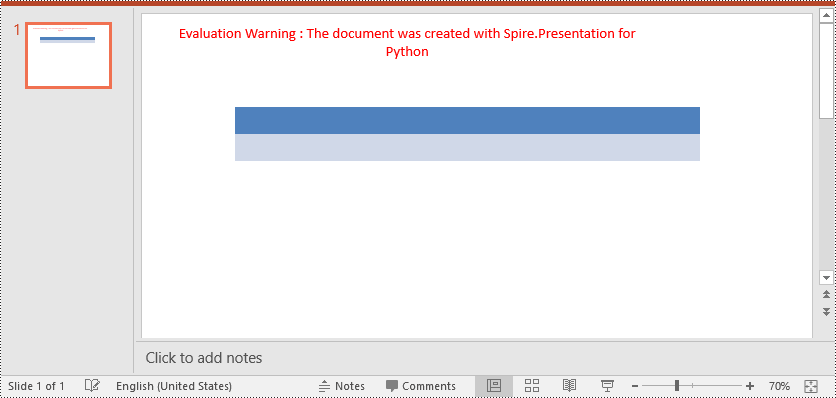
Remove Table Borders in PowerPoint in Python
To remove borders from a table, you need to iterate through the cells in the table and then remove the borders from each cell. The detailed steps are as follows.
- Create an object of the Presentation class.
- Load a PowerPoint presentation using Presentation.LoadFromFile() method.
- Get a specific slide of the presentation using Presentation.Slides[] property.
- Get the table on the slide.
- Iterate through the rows in the table and the cells in each row.
- Remove the borders from each cell by setting the fill type of the top, bottom, left and right borders of the cell as none.
- Save the result presentation using Presentation.SaveToFile() method.
- Python
from spire.presentation.common import *
from spire.presentation import *

# Create a PowerPoint presentation
presentation = Presentation()
# Load a PowerPoint presentation
presentation.LoadFromFile("SetBorders.pptx")

# Get the first slide
slide = presentation.Slides[0]
# Get the table on the slide
table = slide.Shapes[0] if isinstance(slide.Shapes[0], ITable) else None

# Iterate through the rows and cells in the table
for row in table.TableRows:
    for cell in row:
        # Remove borders from each cell by setting the fill type of the top, bottom, left and right borders of the cell as none
        cell.BorderTop.FillType = FillFormatType.none
        cell.BorderBottom.FillType = FillFormatType.none
        cell.BorderLeft.FillType = FillFormatType.none
        cell.BorderRight.FillType = FillFormatType.none

# Save the result presentation
presentation.SaveToFile("RemoveBorders.pptx", FileFormat.Pptx2013)
presentation.Dispose()
Apply for a Temporary License
If you'd like to remove the evaluation message from the generated documents, or to get rid of the function limitations, please request a 30-day trial license for yourself.
Python: Merge or Split Table Cells in PowerPoint
Merging and splitting table cells in PowerPoint are essential features that enable users to effectively organize and present data. By merging cells, users can create larger cells to accommodate more information or establish header rows for better categorization. On the other hand, splitting cells allows users to divide a cell into smaller units to showcase specific details, such as individual data points or subcategories. These operations enhance the visual appeal and clarity of slides, helping the audience better understand and analyze the presented data. In this article, we will demonstrate how to merge and split table cells in PowerPoint in Python using Spire.Presentation for Python.
Install Spire.Presentation for Python
This scenario requires Spire.Presentation for Python and plum-dispatch v1.7.4. They can be easily installed in your Windows through the following pip command.
pip install Spire.Presentation
If you are unsure how to install, please refer to this tutorial: How to Install Spire.Presentation for Python on Windows
Merge Table Cells in PowerPoint in Python
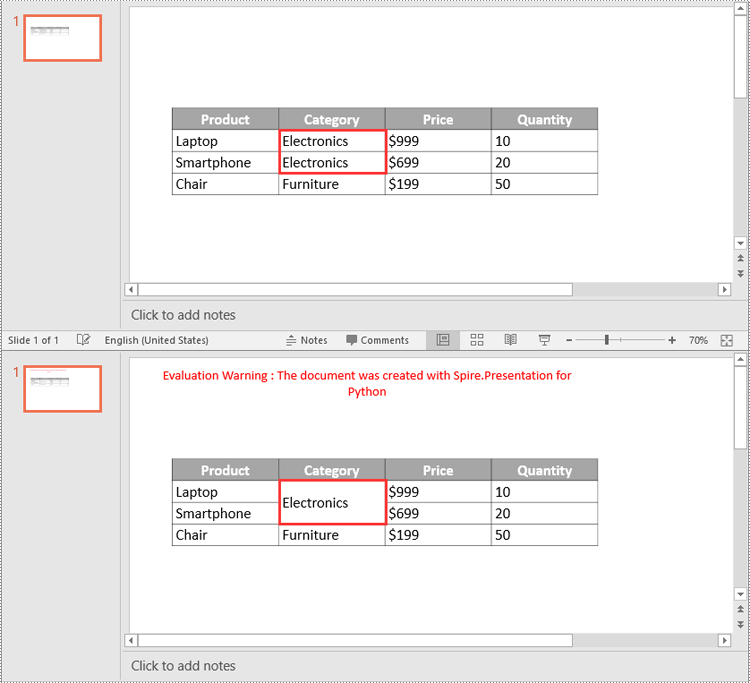
Spire.Presentation for Python offers the ITable[columnIndex, rowIndex] property to access specific table cells. Once accessed, you can use the ITable.MergeCells(startCell, endCell, allowSplitting) method to merge them into a larger cell. The detailed steps are as follows.
- Create an object of the Presentation class.
- Load a PowerPoint presentation using Presentation.LoadFromFile() method.
- Get a specific slide using Presentation.Slides[index] property.
- Find the table on the slide by looping through all shapes.
- Get the cells you want to merge using ITable[columnIndex, rowIndex] property.
- Merge the cells using ITable.MergeCells(startCell, endCell, allowSplitting) method.
- Save the result presentation using Presentation.SaveToFile() method.
- Python
from spire.presentation.common import *
from spire.presentation import *

# Create a Presentation object
ppt = Presentation()

# Load a PowerPoint presentation
ppt.LoadFromFile("Table1.pptx")

# Get the first slide
slide = ppt.Slides[0]

# Find the table on the first slide
table = None
for shape in slide.Shapes:
    if isinstance(shape, ITable):
        table = shape
        # Get the cell at column 2, row 2
        cell1 = table[1, 1]
        # Get the cell at column 2, row 3
        cell2 = table[1, 2]
        # Check if the content of the cells is the same
        if cell1.TextFrame.Text == cell2.TextFrame.Text:
            # Clear the text in the second cell
            cell2.TextFrame.Paragraphs.Clear()
        # Merge the cells
        table.MergeCells(cell1, cell2, True)

# Save the result presentation to a new file
ppt.SaveToFile("MergeCells.pptx", FileFormat.Pptx2016)
ppt.Dispose()
Split Table Cells in PowerPoint in Python
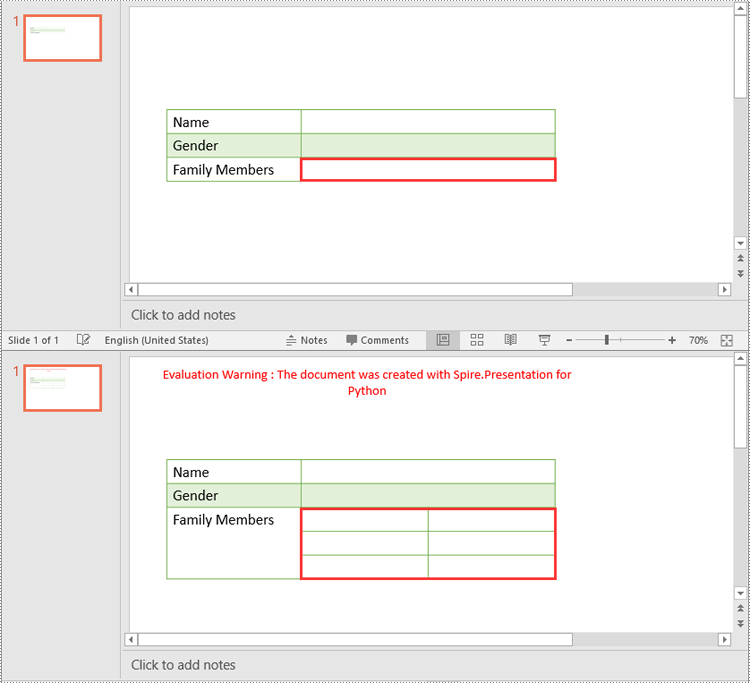
In addition to merging specific table cells, Spire.Presentation for Python also empowers you to split a specific table cell into smaller cells by using the Cell.Split(rowCount, colunmCount) method. The detailed steps are as follows.
- Create an object of the Presentation class.
- Load a PowerPoint presentation using Presentation.LoadFromFile() method.
- Get a specific slide using Presentation.Slides[index] property.
- Find the table on the slide by looping through all shapes.
- Get the cell you want to split using ITable[columnIndex, rowIndex] property.
- Split the cell into smaller cells using Cell.Split(rowCount, columnCount) method.
- Save the result presentation using Presentation.SaveToFile() method.
- Python
from spire.presentation.common import *
from spire.presentation import *

# Create a Presentation object
ppt = Presentation()

# Load a PowerPoint presentation
ppt.LoadFromFile("Table2.pptx")

# Get the first slide
slide = ppt.Slides[0]

# Find the table on the first slide
table = None
for shape in slide.Shapes:
    if isinstance(shape, ITable):
        table = shape
        # Get the cell at column 2, row 3
        cell = table[1, 2]
        # Split the cell into 3 rows and 2 columns
        cell.Split(3, 2)

# Save the result presentation to a new file
ppt.SaveToFile("SplitCells.pptx", FileFormat.Pptx2016)
ppt.Dispose()
Apply for a Temporary License
If you'd like to remove the evaluation message from the generated documents, or to get rid of the function limitations, please request a 30-day trial license for yourself.
Python: Create or Edit Tables in PowerPoint Presentations
A table is a structured way of organizing and presenting data in rows and columns. It usually consists of horizontal rows and vertical columns, and each intersection can contain text, numbers, or other types of data. By inserting a table into a presentation, users can create or display structured data on slides to make the content more organized. In addition, compared to text forms, tabular data can be more intuitive to show the differences between data, which helps readers understand more, thus enhancing the professionalism and readability of the presentation. This article is going to show how to use Spire.Presentation for Python to create or edit a table in a PowerPoint Presentation in Python programs.
- Insert Tables into PowerPoint Presentations in Python
- Edit Tables in PowerPoint Presentations in Python
Install Spire.Presentation for Python
This scenario requires Spire.Presentation for Python and plum-dispatch v1.7.4. They can be easily installed in your Windows through the following pip commands.
pip install Spire.Presentation
If you are unsure how to install, please refer to this tutorial: How to Install Spire.Presentation for Python on Windows
Insert Tables into PowerPoint Presentations in Python
Spire.Presentation for Python provides the Presentation.Slides[].Shapes.AppendTable(x: float, y: float, widths: List[float], heights: List[float]) method to add a table to a PowerPoint presentation. The detailed steps are as follows.
- Create an object of Presentation class.
- Load a sample presentation from disk using Presentation.LoadFromFile() method.
- Define the dimensions of the table.
- Add a new table to the sample presentation by calling Presentation.Slides[].Shapes.AppendTable(x: float, y: float, widths: List[float], heights: List[float]) method.
- Define the table data as a two-dimensional string array.
- Loop through the arrays and fill each cell of the table with these data by ITable[columnIndex, rowIndex].TextFrame.Text property.
- Set font name and font size for these data.
- Set the alignment of the first row in the table to center.
- Apply a built-in style to the table using ITable.StylePreset property.
- Save the result file using Presentation.SaveToFile() method.
- Python
from spire.presentation.common import *
import math
from spire.presentation import *
inputFile = "C:/Users/Administrator/Desktop/Sample.pptx"
outputFile = "C:/Users/Administrator/Desktop/CreateTable.pptx"
#Create an object of Presentation class
presentation = Presentation()
#Load a sample presentation from disk
presentation.LoadFromFile(inputFile)
#Define the dimensions of the table
widths = [100, 100, 150, 100, 100]
heights = [15, 15, 15, 15, 15, 15, 15, 15, 15, 15, 15, 15, 15]
#Add a new table to this presentation
left = math.trunc(presentation.SlideSize.Size.Width / float(2)) - 275
table = presentation.Slides[0].Shapes.AppendTable(left, 90, widths, heights)
#Define the table data as a two-dimensional string array
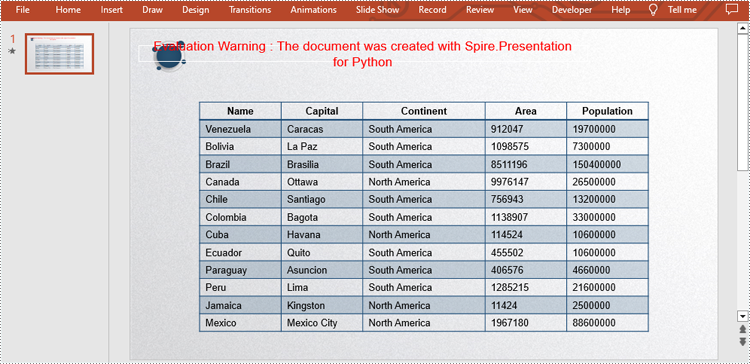
dataStr = [["Name", "Capital", "Continent", "Area", "Population"],
["Venezuela", "Caracas", "South America", "912047", "19700000"],
["Bolivia", "La Paz", "South America", "1098575", "7300000"],
["Brazil", "Brasilia", "South America", "8511196", "150400000"],
["Canada", "Ottawa", "North America", "9976147", "26500000"],
["Chile", "Santiago", "South America", "756943", "13200000"],
["Colombia", "Bagota", "South America", "1138907", "33000000"],
["Cuba", "Havana", "North America", "114524", "10600000"],
["Ecuador", "Quito", "South America", "455502", "10600000"],
["Paraguay", "Asuncion", "South America", "406576", "4660000"],
["Peru", "Lima", "South America", "1285215", "21600000"],
["Jamaica", "Kingston", "North America", "11424", "2500000"],
["Mexico", "Mexico City", "North America", "1967180", "88600000"]]
#Loop through the arrays
for i in range(0, 13):
for j in range(0, 5):
#Fill each cell of the table with these data
table[j,i].TextFrame.Text = dataStr[i][j]
#Set font name and font size
table[j,i].TextFrame.Paragraphs[0].TextRanges[0].LatinFont = TextFont("Arial")
table[j,i].TextFrame.Paragraphs[0].TextRanges[0].FontHeight = 12
#Set the alignment of the first row in the table to center
for i in range(0, 5):
table[i,0].TextFrame.Paragraphs[0].Alignment = TextAlignmentType.Center
#Apply a style to the table
table.StylePreset = TableStylePreset.LightStyle3Accent1
#Save the result file
presentation.SaveToFile(outputFile, FileFormat.Pptx2010)
presentation.Dispose()
Edit Tables in PowerPoint Presentations in Python
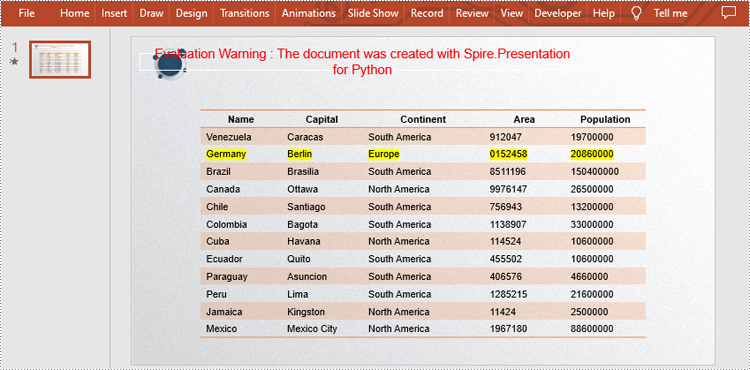
You are also allowed to edit tables in the presentation as needed, such as replacing data, changing styles, highlighting data, and so on. Here are the detailed steps.
- Create an object of Presentation class.
- Load a sample presentation from disk using Presentation.LoadFromFile() method.
- Store the data used for replacement in a string.
- Loop through the shapes in the first slide, and determine if a certain shape is a table. If yes, convert it to an ITable object.
- Change the style of the table using ITable.StylePreset property.
- Replace the data in a specific cell range by using ITable[columnIndex, rowIndex].TextFrame.Text property.
- Highlight the new data using ITable[columnIndex, rowIndex].TextFrame.TextRange.HighlightColor.Color property.
- Save the result file using Presentation.SaveToFile() method.
- Python
from spire.presentation.common import *
from spire.presentation import *

inputFile = "C:/Users/Administrator/Desktop/CreateTable.pptx"
outputFile = "C:/Users/Administrator/Desktop/EditTable.pptx"

#Create an object of Presentation class
presentation = Presentation()

#Load a sample presentation from disk
presentation.LoadFromFile(inputFile)

#Store the data used in replacement in a string
strs = ["Germany", "Berlin", "Europe", "0152458", "20860000"]
table = None

#Loop through shapes in the first slide to get the table
for shape in presentation.Slides[0].Shapes:
    if isinstance(shape, ITable):
        table = shape

        #Change the style of the table
        table.StylePreset = TableStylePreset.LightStyle1Accent2
        for i, unusedItem in enumerate(table.ColumnsList):

            #Replace the data in a specific cell range
            table[i,2].TextFrame.Text = strs[i]

            #Highlight the new data
            table[i,2].TextFrame.TextRange.HighlightColor.Color = Color.get_Yellow()

#Save the result file
presentation.SaveToFile(outputFile, FileFormat.Pptx2013)
presentation.Dispose()
Apply for a Temporary License
If you'd like to remove the evaluation message from the generated documents, or to get rid of the function limitations, please request a 30-day trial license for yourself.