Spire.XLS is a professional Excel API that enables developers to create, manage, manipulate, convert and print Excel worksheets. Get free and professional technical support for Spire.XLS for .NET, Java, Android, C++, Python.
Mon Aug 04, 2014 6:17 pm
I need help in plotting this scatter chart in excel I am having trouble trying to plot the points correctly
Data
- Code: Select all
       9.5    5.4
A     8.5
B              6.6

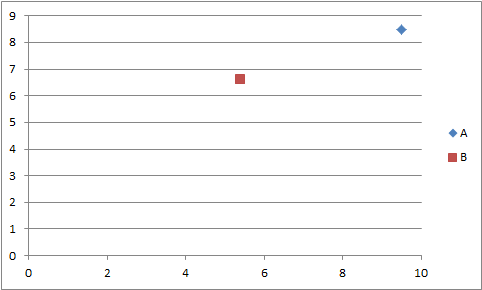
So when I run this code I get a chart that plot the points Series 1 Point 1 (1,9.5)  I want to plot the point to be Series 'A' Point '9.5' (9.5,8.5)
Here is my code:
- Code: Select all
Workbook workbook = new Workbook();
workbook.CreateEmptySheets(1);
//Initailize worksheet
Worksheet sheet = workbook.Worksheets[0];
sheet.Name = "Chart data";
sheet.GridLinesVisible = false;
Double[] xdata = new Double[] { 9.5, 5.4 };
Double[] ydata = new Double[] { 8.5, 6.6 };
Chart chart = sheet.Charts.Add();
chart.ChartType = ExcelChartType.ScatterLineMarkers;
sheet.Range["A2"].Value = "A";
sheet.Range["A3"].Value = "B";
sheet.Range["B1"].NumberValue = xdata[0];
sheet.Range["B2"].NumberValue = ydata[0];
sheet.Range["C1"].NumberValue = xdata[1];
sheet.Range["C3"].NumberValue = ydata[1];
chart.DataRange = sheet.Range["B1:C3"];
chart.SeriesDataFromRange = false;
chart.ChartTitle = "X-Y Chart";
chart.ChartTitleArea.IsBold = true;
chart.ChartTitleArea.Size = 12;
workbook.SaveToFile("Sample.xls");
System.Diagnostics.Process.Start("Sample.xls");
I also provides two image files one the result from my code the other the chart I want to get as a result Thank You
- Attachments
-

- This is the chart that I want to get as a result
- XYChartResult.png (2.79 KiB) Viewed 2605 times
-

- This is that chart when you run my code
- MycodeXYchart.png (6.52 KiB) Viewed 2605 times
-

andrewhoang09
-
- Posts: 8
- Joined: Tue Jul 15, 2014 8:56 pm
Mon Aug 04, 2014 10:09 pm
Also I am having trouble with the legend is there a way to change the legend entries font size?
-

andrewhoang09
-
- Posts: 8
- Joined: Tue Jul 15, 2014 8:56 pm
Tue Aug 05, 2014 2:36 am
Hello,
Thanks for your inquiry.
Please try the following method.
- Code: Select all
Workbook workbook = new Workbook();
            workbook.CreateEmptySheets(1);
            Worksheet sheet = workbook.Worksheets[0];
            sheet.Name = "Chart data";
            sheet.GridLinesVisible = false;
            Double[] xdata = new Double[] { 9.5, 5.4 };
            Double[] ydata = new Double[] { 8.5, 6.6 };
            Chart chart = sheet.Charts.Add();
            chart.ChartType = ExcelChartType.ScatterLineMarkers;
            sheet.Range["A2"].Value = "A";
            sheet.Range["A3"].Value = "B";
            sheet.Range["B1"].NumberValue = xdata[0];
            sheet.Range["B2"].NumberValue = ydata[0];
            sheet.Range["C1"].NumberValue = xdata[1];
            sheet.Range["C3"].NumberValue = ydata[1];
            chart.DataRange = sheet.Range["B1:C2"];
            chart.Series[0].CategoryLabels = sheet.Range["B1:C1"];
            chart.Series[0].Values = sheet.Range["B2:C2"];
            chart.Series[0].Name = sheet.Range["A2"].Value;
            chart.Series[1].CategoryLabels = sheet.Range["B1:C1"];
            chart.Series[1].Values = sheet.Range["B3:C3"];
            chart.Series[1].Name = sheet.Range["A3"].Value;
            //change the legend entries font size
            chart.Legend.LegendEntries[0].TextArea.Size = 24;
            chart.Legend.LegendEntries[1].TextArea.Size = 24;
            chart.ChartTitle = "X-Y Chart";
            chart.ChartTitleArea.IsBold = true;
            chart.ChartTitleArea.Size = 12;
            workbook.SaveToFile("Sample.xls");
            System.Diagnostics.Process.Start("Sample.xls");
If there are any questions, welcome to get it back to us.
Sincerely,
Gary
E-iceblue support team
-


Gary.zhang
-
- Posts: 1380
- Joined: Thu Apr 04, 2013 1:30 am
Thu Aug 07, 2014 9:02 am
Hello,
Have you tested the code provided by my colleague Gary? Has the issue been resolved? Could you please provide us some feedback if convenience?
If you get any questions, welcome to get it back to us.
Regards,
Benjamin
E-iceblue support team
-


Benjamin Du
-
- Posts: 82
- Joined: Thu Jul 25, 2013 2:38 am