
Pie charts and donut charts are two similar types of charts used to show a percentage breakdown of data. Both charts are visually simple and provide an instant understanding of the part-to-whole relationship. In this article, you will learn how to programmatically create a pie chart or a doughnut chart in Excel using Spire.XLS for C++.
Install Spire.XLS for C++
There are two ways to integrate Spire.XLS for C++ into your application. One way is to install it through NuGet, and the other way is to download the package from our website and copy the libraries into your program. Installation via NuGet is simpler and more recommended. You can find more details by visiting the following link.
Integrate Spire.XLS for C++ in a C++ Application
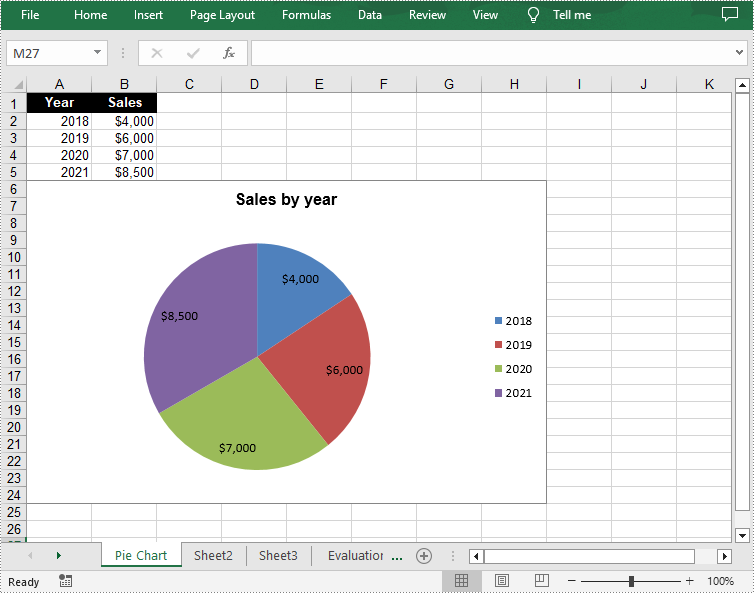
Create a Pie Chart in Excel in C++
A pie chart is a circular graph divided into several sectors. To add a pie chart in a worksheet, you can use the Worksheet->GetCharts()->Add(ExcelChartType::Pie) method provided by Spire.XLS for C++. The following are the detailed steps.
- Create a Workbook object.
- Get a specified worksheet using Workbook->GetWorksheets()->Get() method.
- Add a pie chart to the worksheet using Worksheet->GetCharts()->Add(ExcelChartType::Pie) method.
- Add some data to specified cells and set the cell styles.
- Set data range for the chart using Chart->SetDataRange() method.
- Set the position and title of the chart.
- Get a specified series in the chart and set category labels and values for the series using ChartSerie->SetCategoryLabels() and ChartSerie->SetValues() methods.
- Show data labels for data points.
- Save the result file using Workbook->SaveToFile() method.
- C++
#include "Spire.Xls.o.h";

using namespace Spire::Xls;

int main() {

	//Specify the output file path
	std::wstring outputFile = L"Output\\PieChart.xlsx";

	//Create a Workbook object
	Workbook* workbook = new Workbook();

	//Get the first worksheet and set sheet name
	Worksheet* sheet = workbook->GetWorksheets()->Get(0);
	sheet->SetName(L"Pie Chart");

	//Add a pie chart to the worksheet
	Chart* chart = nullptr;
	chart = sheet->GetCharts()->Add(ExcelChartType::Pie);

	//Set chart data
	sheet->GetRange(L"A1")->SetValue(L"Year");
	sheet->GetRange(L"A2")->SetValue(L"2018");
	sheet->GetRange(L"A3")->SetValue(L"2019");
	sheet->GetRange(L"A4")->SetValue(L"2020");
	sheet->GetRange(L"A5")->SetValue(L"2021");

	sheet->GetRange(L"B1")->SetValue(L"Sales");
	sheet->GetRange(L"B2")->SetNumberValue(4000);
	sheet->GetRange(L"B3")->SetNumberValue(6000);
	sheet->GetRange(L"B4")->SetNumberValue(7000);
	sheet->GetRange(L"B5")->SetNumberValue(8500);

	//Set cell styles
	sheet->GetRange(L"A1:B1")->SetRowHeight(15);
	sheet->GetRange(L"A1:B1")->GetStyle()->SetColor(Spire::Common::Color::GetBlack());
	sheet->GetRange(L"A1:B1")->GetStyle()->GetFont()->SetColor(Spire::Common::Color::GetWhite());
	sheet->GetRange(L"A1:B1")->GetStyle()->SetVerticalAlignment(VerticalAlignType::Center);
	sheet->GetRange(L"A1:B1")->GetStyle()->SetHorizontalAlignment(HorizontalAlignType::Center);

	//Set number format
	sheet->GetRange(L"B2:C5")->GetStyle()->SetNumberFormat(L"\"$\"#,##0");

	//Set data range for the chart
	chart->SetDataRange(sheet->GetRange(L"B2:B5"));
	chart->SetSeriesDataFromRange(false);

	//Set position of the chart
	chart->SetLeftColumn(1);
	chart->SetTopRow(6);
	chart->SetRightColumn(9);
	chart->SetBottomRow(25);

	//Set and format chart title
	chart->SetChartTitle(L"Sales by year");
	chart->GetChartTitleArea()->SetIsBold(true);
	chart->GetChartTitleArea()->SetSize(12);

	//Get a specified series in the chart
	ChartSerie* cs = chart->GetSeries()->Get(0);

	//Set category labels for the series
	cs->SetCategoryLabels(sheet->GetRange(L"A2:A5"));

	//Set values for the series
	cs->SetValues(sheet->GetRange(L"B2:B5"));

	//Show data labels for data points
	cs->GetDataPoints()->GetDefaultDataPoint()->GetDataLabels()->SetHasValue(true);

	//Save the result file
	workbook->SaveToFile(outputFile.c_str(), ExcelVersion::Version2013);
	workbook->Dispose();
}
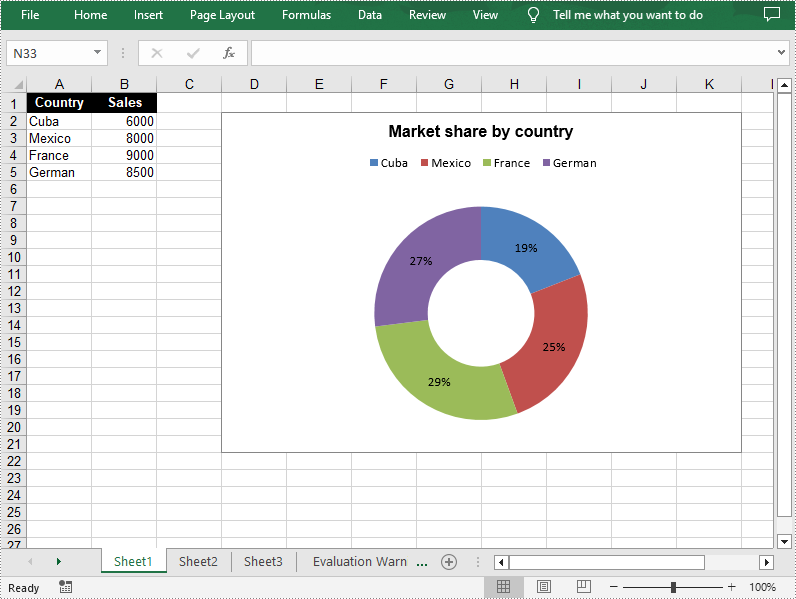
Create a Doughnut Chart in Excel in C++
The doughnut chart is a variant of the pie chart. It has a hole in the center which allows additional information to be displayed. The following are the steps to add a donut chart in an Excel worksheet.
- Create a Workbook object.
- Get a specified worksheet using Workbook->GetWorksheets()->Get() method.
- Add some data to specified cells and set the cell styles.
- Add a chart to the worksheet using Worksheet->GetCharts()->Add() method and then set its type as doughnut chart using Chart->SetChartType(ExcelChartType::Doughnut) method.
- Set data range for the chart using Chart->SetDataRange() method.
- Set the position and title of the chart.
- Show data labels for data points.
- Set the legend position of the chart using Chart->GetLegend()->SetPosition() method.
- Save the result file using Workbook->SaveToFile() method.
- C++
#include "Spire.Xls.o.h";

using namespace Spire::Xls;

int main() {

	//Specify the output file path
	std::wstring outputFile = L"Output\\DoughnutChart.xlsx";

	//Create a Workbook object
	Workbook* workbook = new Workbook();

	//Get the first worksheet
	Worksheet* sheet = workbook->GetWorksheets()->Get(0);

	//Insert data to specified cells
	sheet->GetRange(L"A1")->SetValue(L"Country");
	sheet->GetRange(L"A2")->SetValue(L"Cuba");
	sheet->GetRange(L"A3")->SetValue(L"Mexico");
	sheet->GetRange(L"A4")->SetValue(L"France");
	sheet->GetRange(L"A5")->SetValue(L"German");
	sheet->GetRange(L"B1")->SetValue(L"Sales");
	sheet->GetRange(L"B2")->SetNumberValue(6000);
	sheet->GetRange(L"B3")->SetNumberValue(8000);
	sheet->GetRange(L"B4")->SetNumberValue(9000);
	sheet->GetRange(L"B5")->SetNumberValue(8500);

	//Set cell styles
	sheet->GetRange(L"A1:B1")->SetRowHeight(15);
	sheet->GetRange(L"A1:B1")->GetStyle()->SetColor(Spire::Common::Color::GetBlack());
	sheet->GetRange(L"A1:B1")->GetStyle()->GetFont()->SetColor(Spire::Common::Color::GetWhite());
	sheet->GetRange(L"A1:B1")->GetStyle()->GetFont()->SetIsBold(true);
	sheet->GetRange(L"A1:B1")->GetStyle()->SetVerticalAlignment(VerticalAlignType::Center);
	sheet->GetRange(L"A1:B1")->GetStyle()->SetHorizontalAlignment(HorizontalAlignType::Center);

	//Add a doughnut chart to the worksheet
	Chart* chart = sheet->GetCharts()->Add();
	chart->SetChartType(ExcelChartType::Doughnut);

	//Set data range for chart
	chart->SetDataRange(sheet->GetRange(L"A1:B5"));
	chart->SetSeriesDataFromRange(false);

	//Set position of the chart
	chart->SetLeftColumn(4);
	chart->SetTopRow(2);
	chart->SetRightColumn(12);
	chart->SetBottomRow(22);

	//Chart title
	chart->SetChartTitle(L"Market share by country");
	chart->GetChartTitleArea()->SetIsBold(true);
	chart->GetChartTitleArea()->SetSize(12);

	//Show data labels for data points
	for (int i = 0; i < chart->GetSeries()->GetCount(); i++)
	{
		ChartSerie* cs = chart->GetSeries()->Get(i);
		cs->GetDataPoints()->GetDefaultDataPoint()->GetDataLabels()->SetHasPercentage(true);
	}

	//Set the legend position of the chart
	chart->GetLegend()->SetPosition(LegendPositionType::Top);

	//Save the result file
	workbook->SaveToFile(outputFile.c_str(), ExcelVersion::Version2013);
	workbook->Dispose();
}
Apply for a Temporary License
If you'd like to remove the evaluation message from the generated documents, or to get rid of the function limitations, please request a 30-day trial license for yourself.
